Es un hábito común de la mayoría de los apicultores de sacar toda la miel de las colmenas y luego alimentarlas con jarabe de azúcar, con lo que pueden pasar el invierno.
Pero ahora la pregunta es ¿hasta qué punto perjudica esta dieta artificial a las abejas?
http://resistantbees.com/blog/?page_id=620
Y sólo a través de esta vida más larga se estimula el comportamiento higiénico.
Ahora, sin embargo, llega un estudio científico y dice lo que siempre hemos proclamados:
La alimentación artificial acorta la vida de las abejas
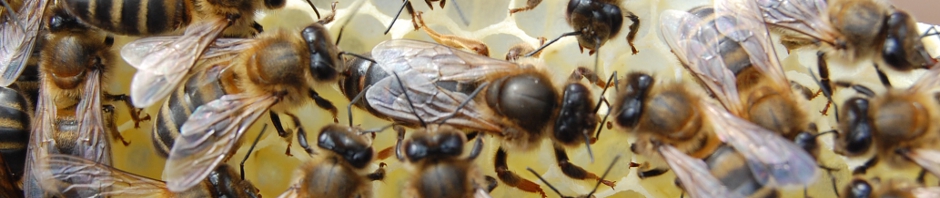
Abejas se alimentaron con miel y con diferentes jarabes de repuesto:
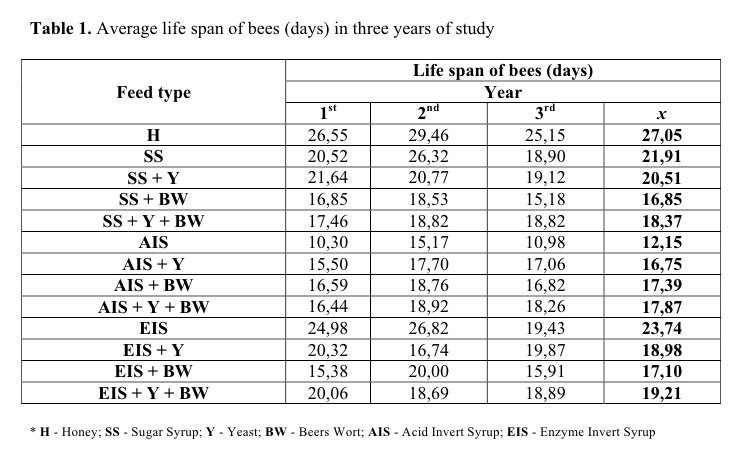
Alimentadas con miel estas abejas vivían un promedio de 27 días, con jarabe de azúcar sólo 21 días, y con jarabe ácido invertido sólo 12 días, mucho menos de la mitad de la vida que con la miel natural.
Y ese fue el resultado resumido:
 en resumen:
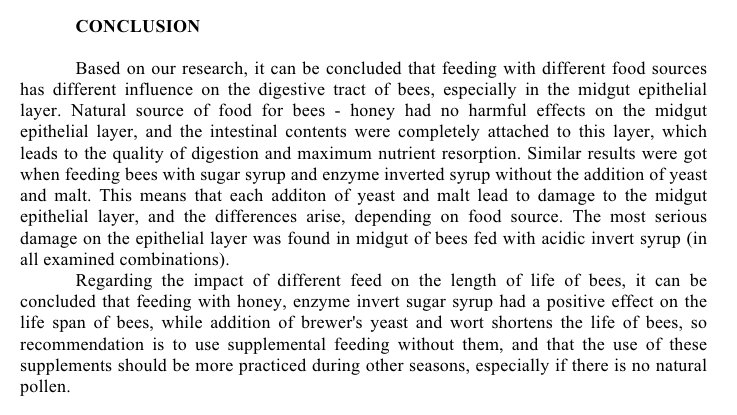
Se puede decir que las diversas sustancias de los alimentos tienen diferentes influencias principalmente en la pared intestinal de abejas. Miel natural no tuvo efectos sobre la mucosa intestinal. Mientras que la adición de levadura y malta al jarabe ha conducido a daños de la mucosa .
Otro estudio muestra:
La alimentación con azúcar influye en la actividad de los genes
EE.UU.- LOS CIENTÍFICOS RASTREAN LA ACTIVIDAD DE LOS GENES CUANDO LAS ABEJAS MELLIFERAS COMEN MIEL Y CUANDO NO LO HACEN
Muchos apicultores alimentan a sus abejas melliferas con sacarosa o jarabe de maíz de alta fructosa en aquellos tiempos en que falta el alimento dentro de la colmena. Esta práctica ha sido objeto de escrutinio, sin embargo, en respuesta al desorden del colapso de colonias, la enorme y aún no totalmente explicada mortandad de las abejas en los EE.UU. y Europa. Algunos sospechan que la nutrición inadecuada juega un papel en la disminución de la población de las abejas
aqui el estudio completo:
Diet-dependent gene expression in honey bees: honey vs. sucrose or high fructose corn syrup
Severe declines in honey bee populations have made it imperative to understand key factors impacting honey bee health. Of major concern is nutrition, as malnutrition in honey bees is associated with immune system impairment and increased pesticide susceptibility. Beekeepers often feed high fructose corn syrup (HFCS) or sucrose after harvesting honey or during periods of nectar dearth. We report that, relative to honey, chronic feeding of either of these two alternative carbohydrate sources elicited hundreds of differences in gene expression in the fat body, a peripheral nutrient-sensing tissue analogous to vertebrate liver and adipose tissues. These expression differences included genes involved in protein metabolism and oxidation-reduction, including some involved in tyrosine and phenylalanine metabolism. Differences between HFCS and sucrose diets were much more subtle and included a few genes involved in carbohydrate and lipid metabolism. Our results suggest that bees receive nutritional components from honey that are not provided by alternative food sources widely used in apiculture.
Introduction
Honey bees are vital members of natural and agricultural ecosystems worldwide. In the United States, the Western honey bee (Apis mellifera) contributes more than 15 billion dollars to the agricultural industry annually1. It is therefore of serious concern that honey bee populations have declined steadily in the United States, with dramatic losses of colonies starting in 2006 associated with colony collapse disorder (CCD)2, 3, 4. These losses have intensified the need to understand factors that impact honey bee health.
Central to honey bee health is nutrition5. Malnutrition in honey bee colonies can result from maintaining densities of colonies that are too high for available flora or placement of colonies for pollination of crops that are deficient in pollen or nectar or have low nutritive value5, 6. Poor nutrition can make bees more susceptible to pesticides7 and lead to a compromised immune system making bees more vulnerable to diseases8.
The principal natural carbohydrate source of honey bees is nectar, which is collected from flowers, transported to the hive and converted to honey for storage. This conversion involves reducing the water content to 16–20% and adding glandular secretions that contain microorganisms and enzymes, including amylases, glucose oxidases and invertases5, 9. These increase acidity and convert the sucrose in nectar into glucose and fructose9. The final constituents of honey vary depending on the nectar source but are mainly fructose (30–45%), glucose (24–40%) and sucrose (0.1–4.8%), as well as trace amounts of other disaccharides, vitamins, minerals, amino acids and a variety phenolic compounds10.
Adult honey bees use honey as fuel for energy-intensive flights and colony thermoregulation9. Unlike larvae, adults have low levels of abdominal lipids and cannot survive for long periods of time without a carbohydrate source. A continuous supply of sugar is particularly important for foraging honey bees, because they have a diet that is mainly carbohydrate-based11. Compared to younger bees that specialize on performing tasks inside the hive, foragers also have a higher metabolic rate12 and lose over half their abdominal lipid stores prior to starting to forage13.
Beekeepers often provide supplemental carbohydrates in the form of high fructose corn syrup (HFCS) or sucrose following the harvesting of honey or during periods of nectar dearth. Supplementing with HFCS became a widespread practice following early studies that showed acceptable honey bee survival14 and equivalent honey production and long-term productivity relative to honey feeding15. In addition, HFCS has a fructose-to-glucose ratio similar to honey, with the most common bee feed formulation composed of 55% fructose and 42% glucose16. HFCS is also less expensive than sucrose and is less labor-intensive to administer as food because it comes in liquid form17.
However, questions regarding the suitability of HFCS for honey bees have arisen, in part because of CCD and because of research showing HFCS may have deleterious metabolic effects in mammals18. Artificial honey produced exclusively from HFCS has a different carbohydrate profile (contains fructosyl-fructose) than artificial honey produced from sucrose19 and has been shown to decrease spring brood and wax production relative to sucrose20. Moreover, there is growing evidence that constituents in natural honey, absent from sucrose and HFCS, positively affect the honey bee’s xenobiotic detoxification system21, 22. These results suggest that honey, sucrose and HFCS may impact honey bee physiology and health differently.
We explored this issue further with whole-genome transcriptomics to comprehensively survey the effects of honey, sucrose and HFCS on fat body gene expression. The fat body is a multifunctional organ responsible for nutrient storage, energy mobilization and the production of antimicrobial peptides. Nutrient storage and mobilization are coupled to hormonal signals that include insulin and adipokinetic hormone to fulfill ongoing physiological demands23. In adult honey bees, the fat body is known to be transcriptionally responsive to nutritional manipulations and manipulations that affect aging and health24, 25. We focused on the fat body to study the effects of different dietary carbohydrate sources on the expression of genes involved in hormonal signaling, nutrient storage, energy metabolism, and immune function. In this study, we used older bees (18–21 days old) because their diet is primarily carbohydrate-based11 and because older bees have been shown to be the primary consumers of carbohydrate supplements inside the hive5.
Results
Measurements taken daily throughout the week-long trials showed similar levels of food consumption for bees fed honey, HFCS or sucrose (0.040 ± 0.001, 0.036 ± 0.002, 0.032 ± 0.003g/bee/day, respectively, F = 4.26 P = 0.055). Mortality also did not vary between diets (F = 0.57 P = 0.59) and was between 0–7% across all cages.
RNA-sequencing (RNA-seq) was performed to examine the effect of each diet treatment on fat body gene expression. In total, 5 sample pools were sequenced per diet treatment and colony replicate (N = 10). Initial examination of our results revealed that one of our colony replicates was heavily infected with deformed wing virus (DWV). For Colony A, an average of 37.06 ± 8.66% reads aligned to the DWV genome sequence compared to only 1.29 ± 2.77% for Colony B. By contrast, an average of 53.81 ± 0.08% of the RNA-seq reads mapped to the honey bee genome for Colony A, while for Colony B the average was 87.72 ± 0.03%. Due to this difference, we analyzed each colony separately. We explored the effects of diet treatment using multidimensional scaling (MDS) plots (using the log fold change of the top 100 genes) generated for each colony. These analyses indicated that chronic feeding of sucrose and HFCS elicited transcriptomic profiles distinct from bees fed a honey diet (Figure S1A and S1B). This pattern was observed for both colonies, indicating similar transcriptomic responses to diet treatments occurred regardless of differences in apparent viral load.
To probe more extensively for diet effects on gene expression, we analyzed the results from both colonies together, assessing the main effect of diet treatment with colony as a blocking factor. Honey elicited hundreds of differences in gene expression relative to HFCS and sucrose (Figure 1A). There were 104 genes differentially expressed (FDR <0.1) in bees fed honey or HFCS and 220 genes differentially expressed between bees fed honey or sucrose. By contrast, differences between HFCS and sucrose diets were much more limited with a total of 8 genes differentially expressed between these two groups. Gene-wise comparisons show a substantial overlap (64 genes) between the honey vs. sucrose (29.1% overlapped) and honey vs. HFCS (61.5% genes overlapped) indicating strong similarities across these gene lists (Figure 1B).

(A) Number of differentially expressed genes (DEGs) for each diet comparison (FDR<0.1). (B) Number of DEGs that overlap among the diet comparisons. (C) Gene Ontology categories significantly enriched (P<0.004) for each diet comparison.
Class prediction analyses using the support vector machine algorithm26 revealed that diet-induced fat body gene expression changes were robust and consistent across samples. Class membership was predicted correctly with 96% (Honey vs. Sucrose), 97.5% (Honey vs. HFCS) and 100% (HFCS vs. Sucrose) accuracy, corresponding to sensitivity values (true positives identified) between 0.92–1 and specificity values (true negatives identified) of 0.95–1. Top predictors for each diet comparison are shown in Figure S2. Notable among top predictor genes for the honey-based comparisons were glutathione S transferase O3 (GB44803) and pale (GB40967), which are associated with xenobiotic detoxification and tyrosine metabolism, respectively. Maltase B1 (GB54549) and two other genes involved in energy metabolism, GB50596 (GO term: oxido-reductase activity) and GB48029 (GO term: acyl carnitine transporter activity), were top predictors for the HFCS vs. Sucrose comparison.
Consistent with class prediction analyses, Gene Ontology (GO) enrichment analyses showed that the lists of genes upregulated by honey were enriched for genes involved in amino acid metabolism and oxidation reduction (Figure 1C, Table S1), especially phenylalanine and tyrosine metabolism. These included pale, henna (GB48022) and homogentisate 1,2-dioxygenase (GB53288). Relative to sucrose, honey also upregulated the gene flavin monooxygenase 1 (GB42239), which was associated with oxidation reduction and alkaloid detoxification27. By contrast, sucrose upregulated genes that were associated with axonogenesis, anion transport, and several transcription factors associated with organ development, such as doublesex (GB55036), knot (GB42304) and tolkin (GB52106), while HFCS upregulated the transmembrane receptors, domeless (GB42244) and tyramine receptor (GB47385) (Figure 1C, Table S1). No GO terms were enriched for the 8 genes differentially expressed between HFCS- and sucrose-fed bees.
To gain further insights into the biological significance of these diet-induced differences in fat body gene expression, we compared our results to three previously published transcriptomic (microarray) experiments on nutritional aspects of behavioral maturation in honey bees24. Behavioral maturation in honey bees involves a switch from a high protein to a high carbohydrate diet and a loss of approximately 50% of fat body lipids13 prior to the shift from working in the hive to foraging. This behavioral and physiological shift also includes a reduction in the blood titers of the lipid storage protein vitellogenin (Vg)28 which has been associated with the promotion of honey bee longevity29 and immunity30. We compared our results to three microarray experiments: 1) Maturation (hive bees compared to foragers); 2) vg knockdown (vg RNAi compared to control); and 3) Diet [bees fed a high protein diet (45% pollen, 45% honey, 10% water) compared to sucrose (50% w/v)]. We detected significant overlap between previously reported changes in fat body gene expression that occur during the hive to foraging transition24 and our present Honey vs. Sucrose and Honey vs. HFCS gene lists (Table 1). Surprisingly, the fat body gene expression profile of the nutritionally enriched hive bees was more similar to that of the sucrose-fed bees, while the profile of the more nutritionally deprived foragers was more similar to that of the honey-fed bees (Table 1). GO enrichment analyses showed that the subset of genes overlapping the Honey vs. Sucrose or Honey vs. HFCS diets and the maturation-related experiment were associated with protein metabolism and oxidation reduction (Table S2). There also was a significant overlap between the Honey vs. Sucrose and Honey vs. HFCS gene lists and the gene list from the vg RNAi experiment24; however, the log fold changes for overlapping genes were not significantly correlated indicating gene lists were not directionally similar (Table 1). There was no significant overlap between our Honey vs. Sucrose and Honey vs. HFCS gene lists and the Diet experiment24, but the genes that did overlap showed a significant positive correlation that suggested honey’s effects were directionally concordant to those of the Pollen + Honey treatment (Table 1).
Discussion
A honey diet elicited a transcriptional profile distinct from sucrose and HFCS diets. These differences were present in two different honey bee colonies, with vastly different viral loads, indicating the impact of honey on fat body gene expression is robust. These results suggest that constituents in honey differentially regulate physiological processes and that sucrose and HFCS may not be equivalent nutritional substitutes to honey.
Gene Ontology enrichment analyses showed honey upregulates genes associated with processes such as “aromatic amino acid family metabolic process,” as well as “oxidation reduction.” Among the genes in these categories were orthologs for the Drosophila melanogaster genes pale and henna, which are related to phenylalanine and tyrosine metabolism. These amino acids have been linked to the production of neurotransmitters31, and in the case of pale to immune responses to infection32. Honey additionally upregulated the gene glutathione S transferase O3, whose activity is known to be induced by plant compounds and to have toxicological significance in the presence of pesticides33. HFCS and sucrose relative to honey resulted in the upregulation of different biological processes. Sucrose, for example, upregulated processes such as axonogenesis but it is unlikely that axonogenesis is upregulated in our fat body samples; rather this GO category reflects upregulation of signaling pathways that play different roles in different tissues. HFCS upregulated the transmembrane receptors domeless and tyramine receptor suggesting differences in JAK-STAT signaling and tyrosine signaling between HFCS and honey.
Sucrose and HFCS elicited a remarkably similar fat body transcriptional response. This result is consistent with previous studies showing no differences in colony productivity due to these diets15 but contrasts with findings showing differences in wax production and honey bee survival due to sucrose or HFCS14, 20. Our results suggest that older bees may not be sensitive to increased fructose consumption because we detected little evidence that reflects the types of changes in hormonal signaling, energy metabolism and nutrient storage associated with high fructose corn syrup and increased fructose consumption in mammals18, 34. Future research should test whether greater differences in gene expression due to sucrose or HFCS feeding are observed in young or middle-aged bees, which perform brood rearing and comb building tasks respectively, or whether the few differences in gene expression observed in this experiment can account for differences in colony performance in more natural conditions.
To understand whether the gene expression differences associated with a honey diet relate to maturation-related physiological changes, we compared our results with previously published fat body microarray studies24. These comparisons showed significant enrichment between honey-based gene lists and genes differentially expressed between hive bees vs. foragers, as well as with gene expression differences associated with vitellogenin RNAi treatment. Functional analyses suggest that shared changes in gene expression were related to protein metabolism and oxidation reduction, suggesting these processes are responsive to direct diet manipulations and maturational changes. Contrary to our expectations, we found the transcriptional profile of honey-fed-bees resembled the less well-nourished foragers rather than the more well-nourished nurse bees. These results suggest that there may be compounds in honey that modulate honey bee physiology towards a forager-like state.
We did not find significant overlap between our Honey vs. Sugar differentially expressed gene list and the previously published list from bees that received either a diet of Pollen + Honey or sucrose. This result is surprising because the former contrast was embedded within this diet-related microarray experiment. This indicates that pollen is largely responsible for the gene expression changes in the diet microarray experiment and that those changes are separate from those elicited by honey in our experiment. Lack of statistical enrichment with pollen-induced changes partially reflects the relatively low level of protein in honey. In addition to the use of different experimental platforms (RNA-seq vs. microarray), there were also differences in the age of the bees assayed in each experiment: the diet-related microarray experiment investigated the effect of diet treatment on younger bees able to digest pollen, while our experiment assayed older bees with a decreased capability to digest pollen. Thus, the transcriptional differences elicited by a honey diet cannot be directly attributed to pollen traces in honey.
Our goal was to perform a broad unbiased survey for the effects of honey, sucrose and HFCS on honey bee physiology. Our result that honey – but not sucrose or HFCS – upregulates genes associated with protein metabolism and oxidation reduction is indicative that honey elicits health-related physiological differences. We performed our experiment using older bees that typically consume sugar solutions inside the hive and do not digest pollen; therefore, constituents in honey may provide critical nutritional components and inducers that are otherwise absent in this age group. Previous research has already identified honey constituents that upregulate detoxification pathways in the gut22; our results further show honey induces gene expression changes on a more global scale. These changes may have toxicological relevance under natural conditions in contemporary agroecosystems, where bees are routinely exposed to toxins and pesticides.
Methods
Bees
We used bees from honey bee colonies from the University of Illinois Bee Research Facility, Urbana, IL, maintained according to standard beekeeping practices. The bees were a mixture of European subspecies typical of this region. To minimize genetic variation within a replicate, we used adult worker bees from a colony derived from a queen inseminated by single male; due to haplodiploidy, these bees were related to each other by an average coefficient of relatedness of 0.75. The experiment was replicated in two independent trials, each time using bees from different, unrelated, colony.
Feeding Trials
We used adult bees between the ages of 18–21 days old. These are older bees that readily consume various carbohydrate sources in the hive5. To obtain focal bees we removed honeycomb frames containing pupae, placed them in an incubator (34°C/30% RH), marked newly emerged one-day-old bees with a spot of paint (Testor’s Paint, Rockford, IL, USA) on the dorsal surface of the thorax and reintroduced the marked bees into their natal colony; this was repeated three consecutive days to obtain a base population of >500 marked bees in the hive. Focal bees were collected when they were 18–21 days old, placed into Plexiglas cages (10 × 10 × 7 cm; 15 bees per cage) and assigned a diet treatment in the laboratory. Diet treatments consisted of 50% (w/v) honey, 50% high fructose corn syrup (HFCS 55) or 50% sucrose ad libitum for each cage replicate (N = 3 cage replicates per treatment). All cages were kept in a 29°C incubator. Consumption and mortality were monitored daily for 7 days. After this time period, bees were flash-frozen and stored at −80°C for analysis.
Dissections and RNA extractions
Dissections were performed by incubating each abdomen in chilled RNA-later ICE (Ambion) at −20°C for a minimum of 16 h. The gut and ventral tissue were then removed and RNA extraction performed on the fat body and adhering dorsal cuticle (RNeasy kit, Qiagen, with a DNAse treatment).
cDNA library construction and RNA-sequencing
We constructed cDNA libraries using pooled total RNA from fat body tissue from 3 individual bees. Pooling was performed to minimize sample variability within treatment groups. Each cDNA library was prepared with 1.5 μg of pooled total RNA and constructed using the NEXTflex™ Directional RNA-seq kit (Bioo Scientific) with an added mRNA purification step using Dynabeads® Oligo(dt)25 (Invitrogen). Library concentrations were quantified using Qubit® fluorometric quantitation and by quantitative real-time PCR using Kapa Library Quant kits (KapaBiosystems). Average fragment size and overall quality was evaluated with the Agilent 2100 Bioanalyzer platform and an Agilent High Sensitivity DNA kit. For sequencing, all libraries were diluted to a 6 nM concentration. In total, we sequenced 5 libraries per treatment per colony, for a total of 30 libraries. Ten libraries were sequenced per lane (2–4 libraries per diet treatment/per lane) with an Illumina HiSeq2000 instrument and were sequenced as single-end, 100 nt reads.
Bioinformatics
RNA sequencing generated an average of 19,200,920 reads per library. Reads from each library were aligned against the Apis mellifera genome, Assembly 4.535 using Tophat36 and read counts were generated for genes using HTSeq v0.5pv2 (http://www-huber.embl.de/users/anders/HTSeq) and the Apis mellifera Official Gene Set, version 3.2. Reads that did not map uniquely or that mapped to genomic locations outside genes were not included in analyses for differential expression. We identified differentially expressed genes (DEGs) using a generalized linear model in the EdgeR package, version 3.2.437.
Because the number of differentially expressed genes in this study was in the hundreds instead of the thousands, we performed an additional analysis to test the robustness of the results. We compared differences in fat body gene expression between two subsets of the entire group of individuals fed on honey (n = 5 per subset), permuting the samples allocated to each subset a total of 100 times. We found only a few genes [2.07 ± 0.344 genes (FDR<0.1)] to be differentially expressed in these comparisons, suggesting that the differences we report between diet treatments are reliable.
Identification of Deformed Wing Virus Infection
Reads that did not align to the Apis mellifera genome were queried using BLAST on the NCBI website. BLAST results identified unaligned reads from Colony A as deformed wing virus (DWV) sequences. We further validated DWV infection by aligning all reads from each sample to the DWV genome (ftp.ncbi.nlm.nih.gov/genomes/Viruses/Deformed_wing_virus_uid14891), using Bowtie 2.
Class Prediction Analyses
To identify the most robust and consistent changes in fat body gene expression caused by each diet, we performed class prediction analyses using the support vector machine algorithm with 5-fold cross-validation. Class prediction analyses were performed using CMA26, with normalized read counts for genes with a P value <0.05. Top predictors for each diet contrast were selected based on their ranking as a top classifier in at least 10 of the 50 iterations.
Gene Ontology Analysis
Inferences for major functional themes for each DEG list were drawn from GO enrichment analyses using the DAVID Bioinformatic Resources 6.7 functional annotation tool38. These analyses were performed using the Drosophila melanogaster orthologs associated with each DEG list. Statistical analyses of enrichment were performed with a hypergeometric test, using the number of honey bee genes with annotated Drosophila orthologs as the reference.
Comparisons to Previous Microarray Studies
Ament et al. (2011) previously published the results of microarray experiments investigating fat body gene expression related to nutritional aspects of behavioral maturation. We compared our results to three of them: 1) Maturation (hive bees compared to foragers; 2) vitellogenin knockdown (vitellogenin dsRNA compared to control; and 3) Diet: [bees fed a high-protein diet (45% pollen, 45% honey, 10% water) compared to sucrose (50% w/v)].
To determine whether the lists of DEGs contained significant levels of overlap, we calculated an enrichment factor (RF) by dividing the observed number of overlapping genes by the expected number. The expected number of overlapping genes was calculated by multiplying the length of each DEG list and then dividing this value by the total number of genes included in the analyses39. An RF value greater than 1 indicates the observed number of overlapping genes is greater than the expected value, thus demonstrating enrichment. Significant enrichment was determined using a hypergeotmetric test (1-tailed) with the p-hyper function in R. To determine whether the overlapping genes between two lists were directionally concordant in the predicted direction, we compared the log-fold changes for each gene list and assessed significance with a Pearson’s correlation. A positive and significant Pearson’s correlation shows the majority of overlapping genes between two gene lists show concordant gene expression changes.
References
- Calderone, N. W. Insect Pollinated Crops, Insect Pollinators and US Agriculture: Trend Analysis of Aggregate Data for the Period 1992–2009. PLoS ONE 7, e37235 (2012).
- Committee on the Status of Pollinators in North America, National Research Council. [Status of Pollinators in North America]. (The National Academies Press, 2007).
- vanEngelsdorp, D., Hayes, J., Jr, Underwood, R. M. & Pettis, J. A Survey of Honey Bee Colony Losses in the U.S., Fall 2007 to Spring 2008. PLoS ONE 3, e4071 (2008).
- vanEngelsdorp, D. et al. A national survey of managed honey bee 2010-11 winter colony losses in the USA: results from the Bee Informed Partnership. J. of Api. Res. 51, 115–124 (2012).
- Brodschneider, R. & Crailsheim, K. Nutrition and health in honey bees. Apidologie 41, 278–294 (2010).
- Haydak, M. H. Honey Bee Nutrition. Annu. Rev. Entomol. 15, 143–156 (1970).
- Wahl, O. & Ulm, K. Influence of pollen feeding and physiological condition on pesticide sensitivity of the honey bee Apis mellifera carnica. Oecologia 59, 106–128 (1983).
- Alaux, C., Ducloz, F., Crauser, D. & Le Conte, Y. Diet effects on honeybee immunocompetence. Biol. Lett. 6, 562–565 (2010).
- Winston, M. L. [The biology of the honey bee]. (Harvard Univ Pr, 1987).
- White, J. W. The Composition of Honey. Bee World 38, 57–66 (1957)
- Crailsheim, K. et al. Pollen consumption and utilization in worker honeybees (Apis mellifera carnica): Dependence on individual age and function. J. Insect Physiol. 38, 409–419 (1992).
- Harrison, J. M. Caste-specific changes in honeybee flight capacity. Physio.l zool. 59, 175–187 (1986).
- Toth, A. L. & Robinson, G. E. Worker nutrition and division of labour in honeybees. Anim. Behav. 69, 427–435 (2005).
- Barker, R. J. & Lehner, Y. Laboratory comparison of high fructose corn syrup, grape syrup, honey and sucrose syrup as maintenance food for caged honey bees. Apidologie 9, 111–116 (1978).
- Severson, D. W. & Erickson, E. H. Honey bee (Hymenoptera: Apidae) colony performance in relation to supplemental carbohydrates. J. of Econ. Entomol. 77, 1473–1478 (1984).
- Hanover, L. M. & White, J. S. Manufacturing, composition, and applications of fructose. Am. J. Clin. Nutr. 58, 724S–732S (1993).
- Barker, R. J. Considerations in selecting sugars for feeding to honey bees. Am. Bee J. 117, 76–77 (1977).
- Bocarsly, M. E., Powell, E. S., Avena, N. M. & Hoebel, B. G. High-fructose corn syrp causes characteristics of obesity in rats: increased body weight, body fat and triglyceride levels. Pharmacol. Biochem. Behav. 97, 101–106 (2010).
- Ruiz-Matute, A. I., Weiss, M., Sammataro, D., Finely, J. & Sanz, M. L. Carbohydrate Composition of High-Fructose Corn Syrups (HFCS) Used for Bee Feeding: Effect on Honey Composition. J. Agric. Food Chem. 58, 7317–7322 (2010).
- Sammataro, D. & Weiss, M. Comparison of Productivity of Colonies of Honey Bees, Apis mellifera, Supplemented with Sucrose or High Fructose Corn Syrup. J. of Insect Sci. 13, 1–13 (2013).
- Johnson, R. M. et al. Ecologically appropriate xenobiotics induce cytochrome P450s in Apis mellifera. PLoS ONE 7, e31051– (2012).
- Mao, W., Schuler, M. A. & Berenbaum, M. R. Honey constituents up-regulate detoxification and immunity genes in the western honey bee Apis mellifera. Proc. Natl. Acad. Sci. USA 110, 8842–8846 (2013).
- Arrese, E. L. & Soulages, J. L. Insect fat body: energy, metabolism, and regulation. Annu. Rev. Entomol. 55, 207–225 (2010).
- Ament, S. A. et al. Mechanisms of stable lipid loss in a social insect. J. Exp. Biol. 214, 3808–3821 (2011).
- Alaux, C., Dantec, C., Parrinello, H. & Le Conte, Y. Nutrigenomics in honey bees: digital gene expression analysis of pollen’s nutritive effects on healthy and varroa-parasitized bees. BMC Genomics 12, 496 (2011).
- Slawski, M., Daumer, M. & Boulesteix, A.-L. CMA: a comprehensive Bioconductor package for supervised classification with high dimensional data. BMC Bioinformatics 9, 439 (2008).
- Naumann, C., Hartmann, T. & Ober, D. Evolutionary recruitment of a flavin-dependent monooxygenase for the detoxification of host plant-acquired pyrrolizidine alkaloids in the alkaloid-defended arctiid moth Tyria jacobaeae. Proc. Natl. Acad. Sci. USA 99, 6085–6090 (2002).
- Nelson, C. M., Ihle, K. E., Fondrk, M. K., Page, R. E. & Amdam, G. V. The gene vitellogenin has multiple coordinating effects on social organization. PLoS Biol. 5, e62 (2007).
- Seehuus, S.-C., Norberg, K., Gimsa, U., Krekling, T. & Amdam, G. V. Reproductive protein protects functionally sterile honey bee workers from oxidative stress. Proc. Natl. Acad. Sci. USA 103, 962–967 (2006).
- Amdam, G. V. et al. Hormonal control of the yolk precursor vitellogenin regulates immune function and longevity in honeybees. Exp. Gerontol. 39, 767–773 (2004).
- Farooqui, T. Review of octopamine in insect nervous systems. Open Access Insect Physiol 4, 1–17 (2012).
- De Gregorio, E., Spellman, P. T., Rubin, G. M. & Lemaitre, B. Genome-wide analysis of the Drosophila immune response by using oligonucleotide microarrays. Proc. Natl. Acad. Sci. USA 98, 12590–12595 (2001).
- Yu, S. J. Insect glutathione S-transferases. Zool. Stud. 35, 9–19 (1996).
- Dekker, M. J., Su, Q. & Baker, C. Fructose: a highly lipogenic nutrient implicated in insulin resistance, hepatic steatosis, and the metabolic syndrome. Am. J. of Physiol. Endocrinol Metab 299, E685-94 (2010).
- Elsik, C. G. et al. Finding the missing honey bee genes: lessons learned from a genome upgrade. BMC Genomics 15, 86 (2014).
- Trapnell, C., Pachter, L. & Salzberg, S. L. TopHat: discovering splice junctions with RNA-Seq. Bioinformatics 25, 1105–1111 (2009).
- Robinson, M. D. edgeR: a Bioconductor package for differential expression analysis of digital gene expression data. Bioinformatics 26, 139–140 (2010).
- Dennis, G. et al. DAVID: Database for Annotation, Visualization, and Integrated Discovery. Genome Biol. 4, P3 (2003).
- Alaux, C. et al. Honey bee aggression supports a link between gene regulation and behavioral evolution. Proc. Natl. Acad. Sci. USA 106, 15400–15405 (2009).

Quiero conocer mas el tema que es muy importante.