A Biometrical Study of the Influence of Size of Brood Cell Upon the Size and Variability of the Honeybee (Apis mellifera L.)
A Biometrical Study of the Influence of Size of Brood Cell Upon the Size and Variability of the Honeybee (Apis mellifera L.)
This Thesis was Submitted to the Graduate Faculty for the Degree of MASTER OF SCIENCE, Iowa State College, 1931.
ACKNOWLEDGMENTS
The author takes this opportunity to express his sincere appreciation and gratitude to all those who have in any way contributed to the task of which this thesis is the culmination. He especially wishes to acknowledge his indebtedness to Dr. O. W. Park for assistance in outlining the several problems involved; to Prof. G. W. Snedecor for assistance in statistical methods and interpretations; to Dr. C. J. Drake for providing facilities for the work; to Dr. G. C. Decker for his kindly interest and many helpful suggestions; to H. C. Dadant for his many helpful suggestions and for furnishing the foundation used in this experiment; and to my wife for assistance in the preparation and measurements of the parts of the worker bee.
INTRODUCTION
A Biometrical Study of the Influence of Size of Brood Cell Upon the Size and Variability of the Honeybee (Apis mellifera L.) by Roy A. Grout, 1931
The keeping of bees for the pleasure derived from them and for the benefits and profits arising from their products has been an important vocation and avocation for many centuries. Due to the interest of naturalists and observers, the study of the size, shape and type of the cells of a colony dates back several centuries before Christ. The first outstanding study of the effect of the size of cell upon the size of the honeybee did not occur until 1791 when Hubor (32), at the suggestion of Bonnet, succeeded in raising worker bees in drone cells and drone bees in worker cells. In the former case, he did not notice any change in the size of the emerging worker bee, but in the latter experiment he observed that the emerging drones were smaller. This study initiated a series of observations of this phenomenon but only Zarudski, according to Michailov (43), noticed any increase in the size of the emerging bees. Martynov, Tuenin end Michailov recently have conducted microscopical investigations concerning this matter and all agree in their conclusions that the bees reared in drone cells are larger than their worker bee sisters.
About the beginning of the 20th century, several controversies arose which concerned the size of the honeybee and its dependability upon the size of the cell. The first of these concerned the effect of the age of the comb upon the size of its emerging bees. It is unquestionable that this had a great influence in bringing about the large cell controversy in France and Belgium. At about the same time, the problem of enlarging the bees became an important issue here in America and a long discussion concerning length of the honeybee probescis and its relation to pollination and honey production ensued. The following is a discussion of the above three controversies in the order given.
The controversy concerning the effects of the age of the brood comb upon the size of the emerging bees emanated from the supposition that the cast-off pupa skin, excrement and varnishing of the cell with the emergence of each generation tended to decrease the size of the cells. Many of the more prominent figures in the beekeeping profession took part in this controversy, the majority contending that the age of the comb had no effect upon the size of each succeeding generation due to the lengthening of the cell by the worker bees. As in the case of the worker bees reared in drone cells, microscopical investigations by Tuenin and Michailov showed that the cells of old combs were smaller and that there was an accompanying decrease in size of the emerging bees.
Baudoux (7) in Belgium was the first to conceive the idea of using a larger size of cell by increasing the size of the cell base on the artificial foundation given to the bees. Others who have worked along this line are Pincot, according to Gillet-Croix (26), and Lovchinovskaya (39). The work of the first two has not been of a very scientific nature but convincing to the extent that manufacturing houses are selling foundation with enlarged cells and claiming good results for the use of same.
The problem of raising larger bees and especially bees having longer tongues or a greater tongue-reach has been a topic of great interest in this country since the beginning of the present century. This problem reached its peak of interest when Root (59) observed one of the colonies in his apiaries foraging on the long corollatubes of the red clover (Trifolium pratense). He later sold on the market queens from the mother of this same colony with the guarantee that they would produce bees having tongues long enough to acquire nectar from red clover. However, these unusual characteristics were soon lost.
Honeybees are not native to America. Since their introduction into this country, an extensive hybridization has taken place. Recently, methods for controlling the mating of the queen bee by artificial means have been discovered but such methods, to date, cannot be used by the commercial beekeepers due to the intricacy of the technique and the low degree of impregnation.
In consequence of the difficulties encountered in controlled breeding and due to the increased use of foundation having enlarged cells in France and Belgium, the attention of a foundation manufacturer in this country has turned to the study of the effects of the enlarged cell upon the size and productivity of bees.
In this paper, a study has been made of the effect of cell size upon the size of the honeybee. No attempt has been made to study the production of colonies reared on large cell foundation due to lack of time, since an experiment of that kind should cover a period of two or more years. The writer realizes that while the crucial test for the commercial use of enlarged foundation is honey production, the present study should be a strong indication toward that end.
REVIEW OF LITERATURE
A Biometrical Study of the Influence of Size of Brood Cell Upon the Size and Variability of the Honeybee (Apis mellifera L.) by Roy A. Grout, 1931
Naturalists and observers have been interested in the size, shape and types of brood cells of a bee colony for many centuries. These studies date back at least to the fourth century B.C. to that ancient pioneer in the development of science, Aristotle. In a review of the literature of this subject we must also mention such outstanding naturalists as Swammerdam, Reamur, Maraldi and the mathematician, Koenig, who observed the marvelously consistent shape of the cells of the honey comb and studied the mathematics of its structure.
According to Ruber (31), Schirach, who discovered that the worker bee was possessed of the same sex as the queen bee, stated that nothing but certain physical conditions, such as a special food and a more spacious lodging, was needed for the worker bee larvae to become real queens. Desiring the support of an eminent philosopher in his contentions, he corresponded with Bonnet, who in turn corresponded with Huber, who confirmed Schirach’s results.
It was the great naturalist, Huber (32), who, in 1791, at the suggestion of Bonnet, first attempted to investigate the effect of the size of cells upon the size of the honeybee. He removed from a hive all combs containing worker cells, leaving only drone combs. Moths invaded the hive, however, and ruined his first experiment. On his second attempt, he observed that the queen finally oviposted with reluctance in the drone comb, but that on the forth day the bees disappeared from their cells. Upon placing in the hive a frame containing sealed drone brood in small cells, he observed that the bees set about to remove the drone brood from the cells so that the queen might have a suitable place to ovipost. Ruber next attempted to rear worker bees in drone cells by grafting the worker bee larvae in the cells of a drone comb by removing the drone larvae and placing them with 1 day old worker larvae. This experiment was successful, but Ruber, upon examining the pupa in an advanced stage, did not recognize any difference in the size of the bees. He then repeated the experiment using drone larvae instead of worker larvae. This time he observed that the drones reared in the drone cells were larger than those reared in worker cells.
Many observers since Huber have conducted similar experiments and have observed the phenomenon of worker brood reared in drone cells sealed with level cappings. Thus, Alley (1), in 1869, records placing a queen and three pounds of bees on drone combs with the result that worker bees were reared in level-capped drone cells. He does not state, however, whether he noticed any changes in the size of the emerging brood. Gundelach, according to Michailov (43), placed a swarm of bees in a glass-walled observation hive on drone comb and observed worker bees emerging from the large cells. Berlepsch (9), in 1876, conducted a similar experiment and confirmed the results of Gundelach. He also cited a similar result obtained by Bessel. Other investigations cited by Michailov (43) were made by Gunther, Klempin, Zarudski, Zesselski, Lehzen and Hanneman, and Buttel-Reepen. Pincot, according to Gillet-Croix (26), investigated the phenomenon at the biginning of the present century and Getaz (25) cites Drory of France and a similar case in Germany. None of the above observers, however, investigated the size of the bee by microscopical examination but depended entirely upon visual examination. Only Zarudski claimed that there was any increase in the size of worker bees due to their rearing in drone cells.
The first microscopical examination of the chitinous parts of worker bees reared in drone cells was conducted in 1901 by Martynov (41), who measured 100 proboscides of bees from the apiary of the Moscow Institute. He determined that the average length of proboscis of worker bees emerging from normal worker cells was 6.06 mm., while the length of proboscis of those emerging from drone cells was 7.01 mm., showing an increase of 0.95 mm.
A similar and more extensive investigation was undertaken by Michailov (43), in 1925, who chanced to find in one of his colonies a drone comb containing worker brood sealed with level cappings. Taking advantage of this opportunity, Michailov, who had previously stated that there was no great difference in the size of worker bees reared in drone cells, made a microscopical examination of 6 characteristics of 200 bees, 100 taken from the drone comb and an equal number from a normal brood comb, taken at approximately the same time. He determined by statistical methods that the bees reared in drone cells were significantly larger than their worker-cell sisters and drew the following conclusions in this respect:
- That worker bees reared in drone cells weigh 11.36% more than worker bees reared in worker cells.
- That the proboscis increases 4.83% in length due to the effect of the larger cells.
- That the increase in the size of cell gives a corresponding increase in the size of the right fore wing, an increase in length of 2.69% and an increase in width of 2.06%.
- That the increase of the size of the cell causes an increase in the sum of the widths of the third and fourth tergites of 4.37%.
- There is no significant differences in the average number of hooks on the right hind wing between the two groups of bees.
- That the bees reared in the drone cells are decidedly more variable than their worker-cell sisters except in the case of the number of hooks on the right hind wing where the variation is consistant in both groups and therefore unrelated to size of cell.
A further pursuit of the literature relating to the effect of the size of the brood cell upon the size and variability of the honeybee leads into several more or less distinct controversies and studies which bear upon the subject from various angles. The first of these controversies concerns itself with an extensive discussion of the length of proboscis and its relation to honey storing ability with special reference to ability to forage upon and pollinate red clover (Trifolium pratense). The second controversy has to do with the effect of the age of the brood comb upon the size of the honeybee. Both of the above controversies have influenced and have operated to bring about a controversy concerning the use of artificial foundation with an enlarged cell base. The last controversy is concerned largely with the study of the variability of social insects due to the variability of the brood cells. Since the above four controversies occurred at approximately the same time, the writer feels that the best method of approach to a review of their literature is to discuss each subject separately.
1. Length of proboscis and its relation to honey storing ability.
The length of proboscis, its relation to honey storing ability and, in particular, its relation to the acquisition of nectar from red clover rose to a peak in this country at the very beginning of the present century. Previous to that time a few observers had noticed honeybees working on red clover, and Rankin (56) had successfully attempted to breed a strain of bees having long tongues. These remarkable traits soon disappeared, however. Root (59) was the first great disciple of the long-tongued worker bee. He discovered in one of his apiaries a colony which was working on red clover. Upon measuring the tongue reach of these bees, he discovered that this colony had an unusually long tongue reach, 0.21 inches, whereas the average tongue reach was only 0.16 inches. He continued by raising queens from the mother of this colony and sold them for “red clover queens”. This desirable quality shortly disappeared due to the inability to control the queen’s mating. It is of interest to note that Kulagin (30) measured the length of proboscis of ten bees that were the progeny of four Root queens that had been sent to Russia by Titoff and found that the average length was 6.22 mm. as compared to an average of 6.21 mm. for the common black bees of Central Russia.
The contentions of Root regarding the tongue reach of these bees and their ability to acquire nectar from red clover raised a voluminous controversy which lasted until the middle of the year 1902 when it was dropped as suddenly as it commenced. Beekeeping savants such as Miller (46), Doolittle (22), Dadant (16), Gillette (27), Getaz (25), Cook (15), Swarthmore (64) and many others investigated and wrote concerning the subject. The greater part of the above mentioned believed that the longer proboscis was directly related to a greater storing ability in spite of the fact that very little scientific research was undertaken. The importance of their controversy lies in their contributions to the technique of measurement, the breeding and selection of bees and the influence of their investigations upon further scientific study along similar lines.
Previous to this time, Wankler (70) of Germany, had attempted to breed for length of proboscis and had invented and used by 1882 an instrument for determining the length of the bee’s tongue. According to Gotze (29), Wankler was the first to show that the bees of different races may differ in the length of their respective proboscides. Likewise, Charton (13), of France, had invented the Charton glossometer in 1892 and by 1897 had presented some figures which seemed to indicate that bees store in proportion to the length of their proboscides.
In Russia, scientific workers have recognized the importance of the relation of the honeybee to the pollination of the red clover and have, for many years, made a very extensive study of the length of the proboscis of the honeybee and the relation of honeybees to seed production. The Russian territory is well suited to such a study since hybridization and shipping of bees from one part of the territory to another has practically never occurred. Klingain, according to Michailov (45), in experiments conducted from 1908 to 1913, showed in his first experiment that bumblebees pollinated 49.4% of the flowers in comparison to 45% in the case of Caucasian bees. In his second experiment he found that bumblebees pollinated 46% while the honeybees pollinated 31.1% of the flowers. He further calculated that it would be necessary to have one colony of Caucasian bees per acre of red clover in order to insure proper pollination.
Chochlov (14) stated that the minimum average length of the red clover corolla tube was 8.34 mm., that the bees push a part of their heads a distance of 0.65 mm. into the corolla tube, and that the nectar rises in the corolla tube a distance of 1 mm. Thus a bee would have to have a proboscis reach of 6.69 mm. to acquire nectar from red clover. Chochlov also found that the Abkhasian bee and the Kars bee of the Caucasus had a length of proboscis equal to 6.69 mm. The essential part of the work done by Chochlov is his establishing for the first time a technique for preparing the proboscis for measurement. His method consisted of anesthetizing with chloroform, killing in boiling water, boiling in potassium hydroxide solution (KOH) and preserving in oil of cloves after the parts had been washed in water for several days. Ewert (23) conducted a similar investigation of the length of the proboscis in relation to the depth of the corolla tube of red clover and essentially confirmed the results obtained by Chochlov.
A more extensive and accurate work on red clover was conducted by Gubin (30), who, contrary to Chochlov and Ewert, showed that the length of the proboscis would have to be from 7.9 mm. to 8.9 mm. in order to reach the nectar in the corolla tube. Since the bees with the greatest length of proboscis were found by Skorikow (63) to be Caucasian bees having a proboscis length of 7.55 mm., Gubin concludes that real red clover bees do not exist in Russia. He also showed that, in using the technique for preparing the proboscis for measurement as set forth by Choclov, the proboscis and other chitinized parts of the skeleton shrink, particularly upon boiling in potassium hydroxide solution, and that the submentum shrinks most (6.31%), the ligula, 3.82% and the mentum only 1.50%. He further showed that by placing the material in a 30% alcohol solution and running it up to a 70% alcohol solution, the shrinkage seldom surpasses 1.5%. Gorbatscheff (28), in 1929, differed with Gubin and claimed the the Caucasian race is the only one which makes use of the nectar of the red clover, but, according to Gotze (29), the material presented by Gorbatscheff is not capable of complete proof.
Additional tests in Russia regarding the relation of the honeybee to the pollination of red clover were made by Manokhin and Koorochkin, according to Michailov (45). Manokhin reported an increase of tenfold in the seed production of red clover influenced by the flight of Caucasian bees in comparison with an isolated field. One plot isolated from insects produced only 180 grams of seed per hectare and another produced but 225 grams; while a similar area, located near Caucasian bees, produced 46.4 kg. and another located near black bees produced 32.5 kg. of seed. The test by Koorochkin in 1926 showed that common local bees of Northern Russia produced seed in 0.99% of the flowers, Caucasian bees produced seed in 10.42% and bumblebees produced seed in 27.93%. Free blooming clover showed seed production in 38.93% of the flowers while a plot isolated from insects showed only 0.27% pollinated.
In 1929, a Russian worker by the name of Savelyeff (62) made an extensive investigation of the effect of various methods of killing, treating and preserving the chitinized parts of the bee skeleton with special reference to the proboscis. In a comparison of two methods, namely boiling fixation plus preservation in 70% alcohol and direct preservation in alcohol without fixation, he arrives at the conclusion the the differences obtained in a composite measurement of the proboscis (submentum plus mentum plus ligula) are not great enough to be due to any reason other than error in measuring. While the mentum showed an increase over the boiling-fixation method plus preservation in 70% alcohol, the submentum showed a decrease, while the ligula showed no significant dufference in length. Thus, contrary to Gubin, Savelyeff showed that the combined measurement of the three parts showed no significant difference due to the treatment. He agreed with Gubin that the use of a coefficient or constant to correct the length of the proboscis is improbable due to the different behavior of the parts. He differs with Gubin, however, in his conclusion that the correlation among the parts of the proboscis is the same as one would find in an examination of untreated material.
Alpatov (2), in 1930, reported the result of an investigation of proboscides preserved and measured in alcohol in comparison with proboscides boiled in a 5% solution of potassium hydroxide. He found that the treatment with potassium hydroxide solution shortened the total length of the proboscis by 2.6%. At the same time he investigated the tongue length of the Mingrel bees (Apis mellifera var. caucasica Gorb.) and showed that this race had the longest proboscis of any of the races of honeybees.
In Germany, Gotze (29), in 1927, declared that the probability of error with the Russian technique was so great that it was impossible to obtain correct results. In consequence, he measured the second member of the labial palpi as an estimation of the length of the proboscis. He also made a scientific examination of the ability of the bees to acquire nectar from several varieties of clover. Following the precedent of Ewert, he did not measure the ovary since the nectar stands above it if nectar is present in sufficient quantity. He found that if the nectar rising in the corolla tube reached a depth of 7.25 to 7.5 mm., the bees of one of his colonies, number 47, could regularly acquire nectar, while the rest of his bees could not work red clover unless the nectar rose beyond this point or the bee had a proboscis longer than the mean of its colony. He concluded that, in general, even those stocks having the longest average length of proboscis do not meet the requirements of clover storing ability; that, with each increase in the length of the proboscis, the ability to acquire nectar from red clover increases markedly; and that certain existing varieties of red clover can theoretically be used by those bees having the longest known proboscides. He maintains that a modification of the length of proboscis due to climate factors has yet to be proven by experimental data, in spite of the fact that Russian workers have shown that the length of proboscis seems to decrease going from south to north.
In regard to the question of how much better use the longer proboscis will prove to be, we must mention Merrill (42), who, in 1922, investigated the relation of length of proboscis, carrying capacity and colony strength to honey storing ability. He determined that a correlation between length of proboscis alone and storing ability could not be found, but that the length of the proboscis plus carrying capacity and colony strength was highly correlated with yield. He concluded that: (1) there is a distinct correlation between length of proboscis, carrying capacity and the amount of honey stored; (2) there is a distinct relation between the number of bees found in the colony in the spring and the size of the above named physical characters; (3) that while it is very strongly indicated that it would be advantageous to a bee to excel in all three of these physical characters, yet, if she is deficient in one character, the disadvantage may be overcome if she possesses one of the other characters to a marked degree.
Hutson (33), in 1926, continued this study, working with small numbers of bees, and confirmed the above results showing that there was no marked agreement between length of proboscis and honey stored, but that there was a marked agreement between the number of bees in a colony and the yield.
Higher yields from long-tongued races have been reported rather frequently. In this connection it is well to note that Merrill and Hutson investigated only modifications of one and the same race. Zander (73), in 1919, reported unusually high yields from Caucasian bees in Germany. The constitution of the honey was at the same time totally different, and Zander believed that this race prepared the honey in a different manner since the source must have been the same. Similarly, Tiadmann (67), in 1925, tells how Cirsium oleraceum had been used by the Krain bees while the native Hannover bees could not acquire nectar from this source. According to Gotze (29), other high yields have been reported by conscientious observers such as Tuschoff and Braun in 1927, but whether these yields were based upon length of proboscis or other properties is not known.
Furthert contributions to the question concerning the acquisition of nectar from red clover have been presented at intervals over a period of years in this country by outstanding figures such as Folsom (24), Phillips (51), Dadant (17), Demuth (20), Dietz (21), Pammell (48), Robertson (58), Pellett (50), and Burrill (11). Robertson believed that the bees perforated the corolla in order to reach the nectar. Dadant confirmed this statement. Pellett believed that bees could reach the nectar in some of the flower tubes, especially in years of drouth. Pammell observed honeybees on red clover but he did not believe, after measuring the corolla tube, that the tube is shortened enough by drouth to enable the bee to reach the nectar in it. Burrill cited many ways in which the honeybee could acquire nectar from red clover by means of perforations of the corolla tube due to other insects, honeydew secreted by aphids on clover, and sap leaks.
2. Age of comb controversy.
The controversy concerning the age of comb and its possible effect upon the size of the emerging brood dates back at least to the middle of the 19th century. Quinby (54), in his book published in 1865, states that old combs are good for a period of 10 to 15 years due to the fact that while the bottoms of the brood cells are filled with cast-off pupa skins, the cocoon, excrement and varnishing resulting from each generation, the side walls are only slightly thickened and the bees lengthen them to compensate for the thickening at the midrib. It is Quinby’s opinion that the cells are unquestionably built larger than necessary. Dadant (18), Miller (47), Root (60), and others took part in this controversy and all believed that the age of the comb did not materially affect the size of the emerging bees.
This controversy first originated in Europe and then spread to our country. Riedenbach (57), of Germany, showed by filling new and old combs with water that although the midrib is noticeably thickened by the emerging generations, the cell volume is not greatly changed due to the lengthening of the side walls. Ludwig (40) coincided with Riedenbach in his contentions and by actual measurement showed that there is no difference existing in the general roominess of brood cells of old and new combs. Brunnich (10) believed that the danger of the cells of old brood combs becoming smaller with age was not as great as many beekeepers believed. Rambaldi (55) reports that in 1927 he had kept Palestine and North African bees on combs built from Root foundation having 856 cell bases per square decimeter during hundreds of generations and had noticed no effect upon the size of the bees.
In Russia the study of the effect of old combs upon the size of the emerging bees was first attempted by Tuenin (68), who showed, by weighing the emerging bees from combs from which 2, 6, 28, and 38 generations had emerged previous to the experiment, that the weight decreased with the number of generations from 0.12612 gms. to 0.10695 gms. and that the cell diameter decreased from 5.262 mm. to 4.99 mm. He concluded that as the number of generations that emerged from the cells became more numerous, the resulting bees became smaller as indicated by the weight of the emerging bees.
Michailov (44) continued this study by measuring 5 physical characters of the skeleton, namely, length of proboscis, length of the right fore wing, width of the same wing, the summation of the widths of the 3rd and 4th tergites, and the number of hooks on the right hind wing. He showed that the size of the cells as reduced by the emerging generations (5.89% in the diameter due to 16 and 18 generations) is accompanied by a significant reduction in the size of bees. By reducing the cell diameter by approximately 3% there was no significant reduction in the body size of the emerging bees. the depth of the cell showed no influence upon the size of the bee. He concluded that, in order to enlarge the bee by using artificial foundation, we should pay particular attention to the diameter of the cell and not to the depth of the cell. According to Rupp (51), who based his conclusions on the work of Michailov, a comb is too old to use for brood rearing when it is three years old based upon the figure of 5 to 6 generations per year.
3. The enlarged cell controversy.
With the invention of artificial comb foundation by Mehring, in 1857, a control of the size of the cells built by honeybees was first accomplished since it was discovered that the bees would build cells with the same dimensions as the imprint of the cell base upon the artificial foundation. The importance of his invention was the elimination of excess drone comb resulting in colonies composed almost entirely of worker comb. It also initiated a study of the exact size of the cells built by bees.
According to Dadant (19), Collin measured the dimensions of cells and stated in 1865 that there were 854 cells per square decimeter. Langstroth repeated the experiment and calculated that there were 838 cells per square decimeter and Charles Dadant confirmed his results. According to Baudoux (8), the following are results concerning the size of the cells of natural comb:
The house of Fratelli Piana in Italy calculated from measurements that there were 860 cells per square decimeter; another house in Italy measured comb from three different colonies and found that there was a considerable variation in the size of cells, namely 813, 807 and 854 cells per square decimeter. Baudoux measured combs taken from two different colonies and found that while the cells of one colony measured 854 cells per square decimeter, the cells from the other measured but 807 cells per square decimeter.
Concerning the size of cells built by different races of bees, Pincot, according to Gillet-Croix (26), reports that the Italian race builds 764 cells per square decimeter, that the bees of Burgundy build 798, that the common black bee native to France builds 854 and that a “degenerated common bee” builds 924 cells per square decimeter. Halleux, in 1890, according to Szezawinski (65), calculated that the black native bees build 845 cells per square decimeter. Rambaldi (55) records the North African bee as building 940 cells per square decimeter.
Baudoux (7), of Belgium, was the first to advocate the use of artificial foundation with an enlarged cell base. In 1893, he reports that a Mr. Fromont measured natural combs and found that the greater part had 825 cells per square decimeter in comparison with certain sheets of artificial foundation which had as high as 907 cells per square decimeter. Baudoux, struck by the reduction in the size of bees from an old skep containing combs having 912 cells per square decimeter, conceived the idea of raising bees in enlarged cells. He accomplished this by means of stretching normal foundation to the size he desired and had by 1896 sufficiently proved his point in Belgium, that a manufacturing company began to place upon the market artificial foundation having an enlarged cell base. It was Baudoux’s contention that the nurse bees, following a natural instinct, filled the bottom of the larger cell more copiously with larval food, that this resulted in a larger bee, He also intimated that the larger bee would generate more body heat which would result in a greater quantity of brood.
By means of stretching foundation, he experimented with various sizes of foundation having 750 cells per square decimeter, 740, 730, 710, 700 and down to 675 cells per square decimeter. By means of a glossometer he determined the tongue reach of his colonies and by means of a thoraxometer, the diameter of the thorax. He found that with an increase of 50 cells per square decimeter in the size of the foundation, there was a corresponding decrease of 0.5 mm. in the tongue reach. His thoraxometer gives a diameter of the thorax as 3.7 mm., 3.9 mm., 4.1 mm., and 4.3 mm. for the bees reared in cells built from foundation having respectively 850, 800, 750 and 700 cells per square decimeter. He arrived at the conclusion that foundation having 700 cells per square decimeter gave a bee which was superior in all its measurements to those reared in combs built from the smaller sizes.
Independent of the work done by Baudoux, Pincot, according to Gillet-Croix (26), arrived at the idea of rearing bees in enlarged cells from a slightly different angle. Noticing the difference in size of the bees from a swarm placed on foundation and the bees of the parent stock reared in natural comb, Pincot came to the conclusion that this phenomenon was due to the natural cells being larger than those drawn from the foundation and actual measurements confirmed his theory. He then started experimenting with foundation having 736 cells per square decimeter and reports that during a two-year period 30 colonies using this size of foundation gathered approximately one-third more honey than did 30 colonies on normal foundation. In 1910 his apiaries were destroyed by a flood and Pincot was forced to abandon his experiments.
Lovchinovskaya (39), of Russia, reports, after present investigations in 1930, that an investigation concerning the effect of enlarged cells upon the size and activity of the honeybee was undertaken in that country in 1925. For this purpose artificial foundation was made with an enlarged cell base of 5.85 mm. against 5.45 mm. in normal cells. The results of one experiment proceeding for 2 years with 10 colonies showed that the honeybees placed on the enlarged cells lived a normal life, both the worker bees and the queen worked normally. When only one frame of the enlarged cells was placed with nine frames of the normal size in a colony, the queen’s attitude toward the enlarged cells was changed and she did not oviposit in the comb in spite of the fact that the bees worked upon it as they did on the other nine combs. When the reverse experiment was undertaken, with nine enlarged combs and one normal comb, the queen laid in the enlarged cells at once. Lovchinovskaya concludes that the worker bees regard with indifference the enlarged cells while the queen prefers the smaller cells.
He continued extensive investigations and showed that: (1) Bees from the enlarged cells weigh more than bees reared in normal cells. (2) The average weight of bees for a singlt year varies according to the conditions operating during the year. (3) The enlarged bees as well as the normal bees are heaviest during May and decrease in weight during the next three months. (4) The weight of bees leaving the hive is greatest during the first half of the day. (5) The weight of emerging bees is between 5% and 6% greater for bees emerging from the large cells. (6) That the emerging bees of both groups weigh more than the old bees. (7) In the case of bees returning to the hive, the weight of enlarged bees exceeds the weight of normal bees by 10.7%, while in the case of bees leaving the hive, the enlarged bees exceed by only 4.8%. (8) The load carried in the honey stomach of the enlarged bee is 52.6% heavier than that carried by the normal bee. (9) That the normal bee carried a load equal to 14% of her own weight while an enlarged bee carries a load equal to 20.4% of her own weight. (10) From the results of one season, the bees reared in the large cells gather more honey than those reared in normal cells, but the production cannot be judged from the data of one season.
4. Studies on the variability of the honeybee with special reference to size of brood cell.
The first paper giving data upon the variability in bees appears to be that of Koshevnikov (36), who, in 1900, studied the number of hooks on the hind wing. In 1905, the same author presented data which could be arranged in the form of a correlation table. Landacre (38), in 1901, counted the number of hooks on the hind wing but, according to Phillips (52), his data was not presented in statistical form. In 1903, Casteel and Phillips (12) made a biometrical study of the wing venation of the drone and worker bees and arrived at the conclusion that the uncreased variability of the drone was due in part to the increased variability of the cells in which they were reared.
Bachmetjew (6), in 1903, began a study of the variability of the hooks on the hind wings of honeybees. His results and conclusions have been strongly criticised in the literature, and Pearl (49), in 1910, wondered whether Bachmetjew was really serious or whether he was attempting to perpetrate a great biometrical joke. Phillips (53) recalculated the data presented by Bachmetjew in 1909 and discovered that the results were entirely normal and agreed with the results of other investigators.
Kellogg and Bell (35), in 1904, showed that there was greater variability in single wing veins than in the length or breadth of the entire wing and that there was a greater variability in the number of hooks on the hind wing than in the wing venation. This variability was as great in workers as it was in drones. Kellogg (34) later made a further investigation and concluded that, except for the number of hooks on the hind wing, drones were more variable than workers. He also found that the variability of drones reared in worker cells was greater than drones reared in drone cells, and stated that this greater variation was not due to special extrinsic factors such as size of cells.
In Russia many studies have been made upon the variability of the honeybee and the factors which influence variation. These investigations have been carried out on a large scale and have been calculated by statistical methods; they constitute a large part of our knowledge concerning the variability of the honeybee. Among these contributions are the works of Michailov, Alpatov, Tuenin, Choclov and others as cited by Alpator (3) in 1929.
Mention should also be made of biometrical studies on social insects, such as the work of Wright, Lee and Pearson (72), in 1907, on Vespa vulgaris from a single nest and by Thomson, Bell and Pearson (66), in 1909, on a general wasp population, In the first named paper, the authors re-examined the data of Casteel and Phillips and agreed that those data show a greater variability in drones than in worker bees, a condition which is reversed in the case of Vespa vulgaris. Other biometrical studies of note concerning social insects include the studies of Warren (71) on termites and the seasonal variation occurring in their forms, Alpatov and Palenitschko (4) who worked on different species of ants, and Arnoldi (5) who presented data concerning the variability of the ant Cardiocondyla stambulowi Forel.
EXPERIMENTAL
A Biometrical Study of the Influence of Size of Brood Cell Upon the Size and Variability of the Honeybee (Apis mellifera L.) by Roy A. Grout, 1931
A. Purpose of Study
The purpose of this experiment is to scientifically study the increase in size and variability of the worker bee as influenced by its rearing in brood cells constructed by worker bees on artificial foundation having an enlarged cell base. Three different cell sizes were used in this experiment. The number of cells per square decimeter were, 857, 763 and 706. The foundation having 857 cells per square decimeter is the standard commercial size manufactured in the United States while the two latter sizes approximate that having 750 cells per square decimeter which has been manufactured since 1896 by Jos. Mees Sons of Herenthals, Belgium and that having 700 cells per square decimeter which the same firm has manufactured since 1927.
B. Methods and Materials.
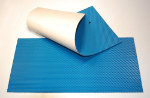
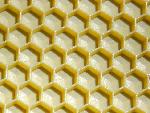
The foundation used in the experiment was furnished by Dadant and Sons, of Hamilton, Illinois. The sizes furnished were 857 cells per square decimeter (standard size manufactured in the United States), 763 cells per square decimeter and 706 cells per square decimeter. The two latter sizes were selected by Mr. H. C. Dadant and are approximately the same sizes as those being placed on the market by foundation manufacturers in Belgium and parts of France. The cutting of special dies and the manufacturing of the foundation were personally superintended by Mr. Dadant in order that the resulting cell bases should be true hexagons. The foundation received with the first shipment contained 7 vertical wires embedded in each sheet of wax. In addition to the vertical wires 4 horizontal wires were placed in the frames and embedded in each sheet of wax by hand. Some trouble was experienced with this foundation due to its warping between the embedded wires in warm weather. In the second shipment the foundation contained 10 wires embedded in the vertical position, which, when placed in a frame wired with 4 horizontal wires, did not warp and resulted in perfect combs when drawn out by the bees.
Some combs were used which had been constructed from special foundation placed in certain colonies during the summer of 1929 by Dr. O. W. Park. To facilitate recognition and handling of the combs, the system used by Dr. Park in marking the frames was followed in this experiment. The frames containing the standard-size foundation, having 857 cells per square decimeter, were marked “A” and one notch was cut in the top-bar. Likewise, the frames containing the foundation having 763 cells per square decimeter were marked “B” and two notches were cut in the top-bar; while the frames containing foundation having 706 cells per square decimeter were marked “C” and three notches were cut in the top-bar.
Since it is a well established fact that under normal conditions bees will extend the side walls of the cell and construct a comb containing cells of the same diameter as the imprint of the cell base on the artificial foundation, no control of size of cell other than special foundation was exercised.
Frames containing all three sizes of foundation were placed in each of 23 colonies of the Iowa State College Apiary early in the summer of 1930. In general, two frames of each size were placed in each colony. Individual colony records were kept and the queens were marked by clipping the right wings of those reared in an even-numbered year and left wings of those reared in an odd-numbered year.
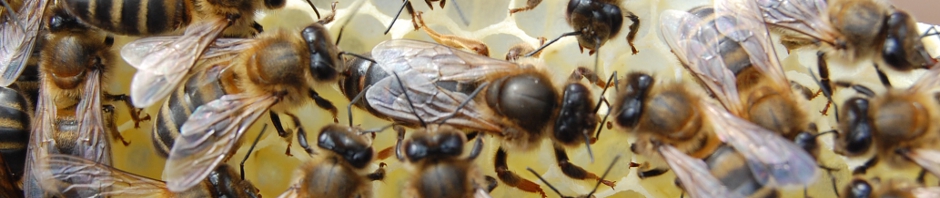
An effort was made to collect the bees upon emergence from all three sizes of cells in a single colony at approximately the same time and under the same conditions. For this purpose a chart was made whereby the daily emergence of the bees from each size of cell was kept for all of the 23 colonies. Each frame was caged in a Root Nucleus Introducing Cage a day or two before the time of emergence and a selected area of brood was covered with an additional small screen cage insuring that the emerging bees would have no access to any nectar or honey. During the honeyflow, it was often difficult to find an area of brood that did not contain some uncapped cells of nectar and honey, and bees were not collected from such combs.
Each sample collected from a brood comb contained at least 50 bees. During the summer of 1930, over 6000 bees were collected. During June of 1931, over 600 bees were collected. From these collections, approximately 3500 were selected as being most suitable for the experiment. The bees of this group were in sets of 150 bees consisting of three samples of 50 bees each taken from each of the three sizes of cells from the same colony, from the same mother and at approximately the same time.
After collecting each sample, the bees were slightly anesthetized, either with ether or calcium cyanide, and then killed by dropping into boiling water. This method of killing, as shown by Alpatov (3), caused the proboscis to be fully extended. The sample was then preserved in a 70% alcohol solution for further treatment.
The general plan of procedure for measuring the size of the individual bees of a sample consisted of the following treatment: (1) Determining the weight of the individual bee. (2) Dissecting the right fore wing, the third tergite, the fourth tergite and the proboscis of each individual bee. (3) Mounting these parts for measurement. (4) Measuring the parts.
Experiments showed that an individual bee taken from a 70% alcohol solution, dried for a few minutes on a filter paper and placed on a chemical balance lost weight faster than it could be accurately weighed. It was thought best, therefore, to take the individual dry weight of each bee. Further experiments were run which showed that, by removing the bees from the 70% alcohol solution, drying on filter paper for several minutes to remove excess preservative and placing the sample in a De Khotinsky Constant Temperature Oven Appliance at a constant temperature of 70 degrees centigrade for 48 hours, the individual bees of the sample no longer lost any appreciable weight. The sample was then placed in a desiccator containing concentrated sulfuric acid. Further experiments showed that after 72 hours the bees had become thoroughly dried and no appreciable loss of weight occurred.
The individual bees were then taken from the desiccator and weighed by means of an Eimer and Amend chemical balance accurate to 0.1 mg. A container of fresh calcium chloride was kept within the chemical balance at all times to dehydrate the contained atmosphere. It was also found that the repeated opening of the desiccator during a long series of weighings caused the individual bees to increase in weight. This necessitated the weighing of a test sample at intervals during an extended series of weighings to determine the average gain in weight of the individual bees. All weights given in this experiments have, therefore, been corrected for this factor.
After weighing, each bee was placed in a numbered vial containing tap water at room temperature and throughout the following treatment was recognized as a definite individual. After being in the water for 24 hours, the bees were soft enough for dissection. With the aid of a Spencer Binocular Microscope, containing a 3.5x ocular and a 55 mm. objective, and an ordinary dissecting set, the right fore wing, the third tergite, the fourth tergite and the proboscis of each bee were dissected. The dissected parts were then mounted directly upon numbered glass slides with Bueston’s medium* and cover glasses were applied.
| *Bueston’s Medium for Mounting | |
| Water …………………. | 50 c.c. |
| Glycerine ……………… | 20 c.c. |
| Gum Arabic …………… | 40 gm. |
| Chloral Hydrate ……… | 50 gm. |
| Dissolve Gum Arabic in water. When dissolved, add Chloral Hydrate. When this is dissolved, add Glycerine. Filter. |
|
All linear measurements were taken by a projection method. The numbered glass slide was placed in a Leitz Simple Micro-Projector in a vertical position and projected upon a movable screen attached to the opposite wall. Upon the face of the screen was a horizontal and vertical scale and the screen was so constructed that the entire face could be rotated around its center in a plane perpendicular to the line of projection. This feature greatly facilitated measuring the projected parts since the measuring scale could be turned to any desired angle at which the part to be measured might happen to lie. The projection measurement apparatus was arranged so that a glass Spencer stage micrometer, having a scale 2 mm. in length ruled to 0.01 mm., placed in the Micro-Projector gave a corresponding projection of 2 mm. magnified 127 times on the scale of the movable screen.
The apparatus was calibrated by this method before and at intervals during each long series of measurements. It was thus possible to read directly the exact measurement of the part in hundredths of a millimeter. However, for the sake of convenience and in order to eliminate any personal equation involved in the reading of actual measurements of the parts of the bee, a reading was taken at the beginning of the part and another at its end, the true measurement being the difference between the two readings. Plate 1 diagrammatically shows the measurements taken on the right fore wing, the third tergite and the fourth tergite. Following the system used by Michailov (43), the widths of the third and fourth tergites were combined and the summation of the two widths was used thruout the computation.

Plate 1. Diagram showing measurements of right fore wing and tergites 3 and 4.
Plate 2 diagrammatically shows the measurements of the proboscis. In this manner the length of the submentum, the length of the mentum and the length of the glossa were obtained, the summation of the three lengths being the length of the proboscis. In only one group of bees was the length of the second member of the labial palpi taken.

Plate 2. Diagram showing measurements taken of the proboscis. G = from tip of labellum to anterior part of mentum. M = length of mentum. S-M = length of submentum. L = length of 2nd member of labial palpi. Length of proboscis = G + M + S-M.
The computation of the statistics was accomplished by recording the values of the measurements of each individual bee on a Hollerith Electric Tabulating and Accounting Machine. From the summations obtained in this manner, the arithmetic means, standard deviations, correlation coefficients, regression equations and other statistical constants were computed with the aid of a Monroe Calculating Machine. All formulas and methods used in the above computations are given by Wallace and Snedecor (69) in their bulletin entitled “Correlation and Machine Calculation” as revised by Snedecor in 1931.
C. Presentation of Data.
1. The size of the worker bee as influenced by size of brood cell.
A study of the three sizes of cells used in this experiment and their relation to each other reveal the following data. To facilitate an understanding of this and following data the size of the cell contained in a comb having 857 cells per square decimeter will be designated as size of cell “A”; the size of cell contained in a comb having 763 cells per square decimeter will be designated as size of cell “B”; in a similar manner the size of cell contained in a comb having 706 cells per square decimeter will be designated as size of cell “C”. Between the sizes of cells “A” and “B” there is a reduction of 94 cells per square decimeter and between the “B” and “C” sizes there is a reduction of 57 cells per square decimeter, making a total reduction of 151 cells per square decimeter between the “A” and the “C” size. It was also thought advisable to investigate the increase of linear measurement of the cell and it was found that there was an increase of 5.98% in the diameter of the cells between the “A” and the “B” size, an increase of 3.96% between the “B” and the “C” sizes and an increase of 10.18% between the “A” and the “C” sizes of cells.
From the bees collected during the summer of 1930, data are presented in this thesis on the bees from three colonies. A sample containing at least fifty bees was collected from colony 25 from an “A” comb on August 21, 1930. One week later, on the 28th of August, two samples of bees were collected from a “B” and a “C” comb, respectively. The bees from colony 21 were collected within a period of two days, two samples being collected from an “A” and a “B” comb, respectively, on August 18, 1930, and a third sample from a “C” comb on August 20, 1930. The bees from colony 18 were collected over an extended period of time. One sample was taken from an “A” comb on August 30, 1930, another from a “C” comb on September 7, and the third from a “B” comb on September 23. The individual hive records of these three colonies show that the bees from each colony were the progeny of the same mothers.
From the samples of bees collected from colony 25, complete data were obtained on 44 bees of the sample from the “A” comb, 47 bees from the sample from the “B” comb and 45 bees from the sample from the “C” comb. Similarly, data are presented on 40 bees from the “A” comb from colony 21, 43 bees from the “B” comb and 45 bees from the “C” comb. In the case of colony 18, complete data were obtained on 41 bees from the “A” comb, 48 bees from the “B” comb and 50 bees from the “C” comb.
The influence of the increase in the size of the brood cells upon the size of various measurements taken on the parts of the individual worker bees of colony 25 is shown in Table 1. The measurements presented for comparison, given in column 1, are dry weight, length of right fore wing, width of right fore wing, sum of the widths of the third and the fourth tergites, length of proboscis, length of mentum, length of glossa and the sum of the lengths of the mentum and the glossa. In the second, fourth and sixth columns are given the arithmetic mean of each measurement and the standard deviation of the mean on the groups of bees from each of the three sizes of cells. In the third column are given the differences between the arithmetic means of the bees from size of cell “A” and the bees from size of cell “B” and the standard deviation of the mean difference. The differences between the means of the bees from size of cell “B” and the bees from size of cell “C” are presented with their standard deviations in column 5. Similarly, the differences between the means of bees from size of cell “A” and size of cell “C” are presented with their standard deviations in the seventh column.
The values of the mean differences that are statistically significant are starred. The test for significance was accomplished by dividing the mean difference by its standard deviation and comparing the resulting values with the corresponding “t” values given in Table 16 by Wallace and Snedecor (69).
All values of the mean differences between the 8 characters of bees from size of cell “A” and bees from size of cell “B” are statistically significant and are therefore greater than would be the case if the bees were selected at random from the same population. In a comparison of the values of the bees from size of cell “B” and size of cell “C” it is shown that, with the exception of length of mentum, all means of the bees from size of cell “A” and size of cell “C” differ significantly in all eight cases.
In Graph 2 is presented a frequency diagram of the character dry weight for each of the three samples of colony 25. An examination of the three curves, each representing the frequency distribution of the bees from one size of cell, shows that not only do the arithmetic means and peaks of the curves differ widely but also the distributions, since the curves scarcely overlap. There is also a difference in the types of the curves. While the curves representing the frequency distribution of the dry weight of bees from size of cell “A” and size of cell “B” are quite similar, the curve representing the dry weight of the bees from size of cell “C” shows a much more extensive distribution.
The frequency distribution of the character length of right fore wing is presented graphically in Graph 3. It is of interest to note that there is a trend in the peaks of the curves and the frequency distributions showing that not only do the means of the groups differ significantly but that the group as a whole tends to increase in size as the size of the cell, with which it is associated, increases.
The frequency distributions of the characters, width of right fore wing, sum of the widths of the third and the fourth tergites and the length of proboscis are presented graphically in Graphs 4, 5 and 6, respectively. The curves of Graphs 4 and 5 show that there is a trend both in the peaks of the curves and in the curves themselves toward a larger value of the measurement of the character with an increase in the size of the cell from which the sample is taken. The curves represented in Graph 6 do not show the familiar trend between the peaks of the two curves representing the length of proboscis of bees from size of cell “A” and size of cell “B”. There is, however, a distinct difference between the peaks of the curves representing this character for bees from size of cell “B” and size of cell “C”. The trend of the distribution curves in all three cases is from a smaller to a larger length of proboscis as the size of cell is increased.
It is also of interest to investigate the percent increase of the arithmetic means of the various measurements of the bees as the size of the cell is increased. Dry weight, which is a measurement of mass and consequently volume, increases markedly from 15.50% to 51.28%, as the size of cell increases. The linear measurements show an average increase of 1.37% as the area of the cell base is increased 12.32%, an average increase of 1.00% as the area of the cell base is increased 8.07% and an average increase of 2.38% as the area of the cell is increased 21.39%. By comparing the average percent increase of the linear measurements to the increase of the diameter of the cell it is discovered that as the diameter of the cell is increased 5.98% there is an increase of 1.37% in the average linear measurement, that, with an increase of 3.96% in the diameter of the cell there is an average increase of 1.00% in the linear measurements and that an increase of 10.18% in the diameter of the cell is accompanied by a corresponding increase of 2.38% in the average measurements of the worker bees. It is of interest to note here that the ratios of the percent increases of the diameters of the cells are approximately the same as the ratios of the percent increases of the average dimensions of the worker bees.
The percent increase of the linear measurements on the various parts of the bees are shown diagrammatically in Graph 1 and the percent increase of all measurements is given below in tabular form.
| Measurement Taken | Percent Increase from “A” to “B” | Percent Increase from “B” to “C” | Percent Increase from “A” to “C” |
| Dry weight | 15.50% | 30.98% | 51.27% |
| Length of right fore wing | 0.60 | 0.89 | 1.49 |
| Width of right fore wing | 1.05 | 1.15 | 2.21 |
| Sum of widths of third and fourth tergites | 2.24 | 1.45 | 3.72 |
| Length of proboscis | 0.93 | 1.13 | 2.07 |
| Length of mentum | 1.49 | 0.11 | 1.61 |
| Length of glossa | 1.21 | 1.22 | 2.45 |
| Sum of lengths of mentum and glossa | 1.28 | 0.90 | 2.19 |
| Average of seven linear measurements | 1.37 | 1.00 | 2.38 |
The influence of the increase in the size of the brood cells upon the size of the worker bees from colony 18 is shown in Table 2. The data presented in this table consist of the arithmetic mean and the standard deviation of the arithmetic mean of the bees from the three sizes of cells and the mean difference and the standard deviation of the mean difference between each of the three groups. The measurements presented in the table are dry weight, length of right fore wing, width of right fore wing, sum of the width of the third and fourth tergites and length of proboscis. The mean differences which are statistically significant are starred.
An examination of Table 2 shows that between the means of the measurements taken on the bees from size of cell “A” and size of cell “B” there is only one case where the difference is significant. This is in the case of dry weight and in a negative direction. Table 2 further shows that there is a decrease in the length of the right fore wing between size of cell “A” and size of cell “B”, but the mean difference in this case is not significant. The other three measurements, width of right fore wing, sum of the widths of the third and the fourth tergites and length of proboscis show an increase in their respective means but the mean difference is not significant.
An examination of the arithmetic means of bees from size of cell “B” and size of cell “C” shows that the mean differences between the three groups are significant with the exception of the width of the right fore wing. In the case of the right fore wing there is an increase between the “B” and “C” groups but the increase is not statistically significant. An examination of the arithmetic means of the bees from size of cell “A” and size of cell “C” tells a similar story. The mean differences of all measurements are significant except for the measurement of the width of the right fore wing, whose means, while showing an increase from size of cell “A” to size of cell “C”, do not show a significant mean difference.
The influence of the size of the brood cell upon the size of various measurements taken on the bees from colony 21 is shown by a comparison of the arithmetic means of the measurements of the bees from size of cell “A”, size of cell “B” and size of cell “C”, respectively, in Table 3. Data presented in this table includes the erithmetic mean and it’s standard deviation for each measurement of the bees from each size of cell and the mean difference and its standard deviation for each measurement between the means of the bees of each group. The measurements taken on the parts of the bees of colony 21 and presented in Table 3 are dry weight, length of the right fore wing, width of the right fore wing, sum of the widths of the third and fourth targites and length of proboscis. The mean differences which are statistically significent are starred.
An examination of Table 3 shows that the mean differences for the measurements between the bees from size of cell “A” and size of cell “B” are all significant except for dry weight. There is a decrease in the dry weight of the bees of these samples as the size of the cell is increased, but the decrease is not large enough to be significant. There are no significant mean differences between the bees from size of cell “B” and size of cell “C” although all measurements, except the width of the right fore wing, show an increase as the size of cell is increased. An examination of the mean differences of the measurements on bees from size of cell “A” and size of cell “C” show that in all measurements, except dry weight, the mean differences are significant and that in all measurements there is an increase accompanying the increase in the size of brood cell.
2. The variability of the worker bee as influenced by size of brood cell.
In Table 4 are presented the correlation coefficients of measurements taken on the parts of the worker bees from the three sizes of cells from colony 25. The measurements taken upon the individual bees are given in column 1. Sizes of cell is designated in the second column. In the third column are presented the correlation coefficients of length of right fore wing with dry weight for each size of cell. The correlation coefficients of width of right fore wing with dry weight and width of right fore wing with length of right fore wing, for each of the three sizes of cells, are given in column 4. The correlation coefficients of the sum of the widths of the third and the fourth tergites with dry weight, with length of right fore wing and with width of right fore wing for each size of cell are given in column 5. Similarly, the correlation coefficients of length of proboscis, length of glossa, length of mentum, and the sum of the lengths of the mentum and the glossa with corresponding measurements in column 1 are given in columns 6, 7, 8 and 9, respectively, for the bees from each of the three sizes of cells. Those values which are starred with one star are highly significant correlations, while those values which are starred with two stars are significant correlations but not highly so. The values which are not starred have failed to meet the requirements of significance. Significance of the correlation coefficients was determined by comparing the values obtained with significant values of “r” given in Table 16 by Wallace and Snedecor (69).
Concerning the data presented in Table 4, the following assertions can be made: (1) The length of the right fore wing is significantly correlated with dry weight for the bees from all three sizes of cells, but only in the case of bees from size of cell “A” is the correlation highly significant. (2) Dry weight is highly significantly correlated with width of right fore wing in the case of bees from size of cell “A” and size of cell “B”, while in the case of bees from size of cell “C” the correlation coefficient approaches significance. (3) The correlation coefficient of the sum of the widths of the third and the fourth tergites with dry weight is highly significant in the case of the bees from size of cell “A”, is significant but not highly so in the case of the bees from size “B”. (4) The correlation of dry weight with length of proboscis, length of glossa, length of mentum, and the sum of the lengths of the mentum and the glossa is significant only in the case of bees from size of cell “A”. (5) The correlation of length of right fore wing with width of right fore wing is highly significant. (6) The correlation of length of right fore wing with the sum of the widths of the third and the fourth tergites is significant, but not highly so in the case of the bees from the size of cell “A” and size of cell “C”. The correlation coefficient in the case of bees from size of cell “B” is not significant. (7) A study of the correlation coefficients of length of right fore wing with length of proboscis and its integral parts shows a tendency for the correlation coefficients to be highly significant in the case of bees from all three sizes of cells. (8) There is no significant correlation between width of right fore wing and the sum of the widths of the third and the fourth tergites. (9) Concerning the correlation of the width of right fore wing with length of proboscis and its integral parts, there is a tendency for the correlation coefficient to be highly significant in the case of bees from size of cell “A”. In the case of the bees from size of cell “B” the tendency is for the correlation coefficient not to be significant and in the case of the bees from size of cell “C” the tendency is for the correlation coefficient to be significant but not highly so. (10) The correlation of the sum of the widths of the third and the fourth tergites with length of proboscis and its integral parts is not significant. (11) As would be expected, the correlation of the length of proboscis with length of glossa, length of mentum and the sum of the lengths of the mentum and the glossa is highly significant. (12) Concerning the correlation between length of glossa and length is not significant. (13) As would be expected, the correlation of the sum of the lengths of the mentum and the glossa with its integral parts, namely, length of mentum and length of glossa, is highly significant.
Data are presented in Table 5 concerning the correlation coefficients of measurements on bees from colony 21. The arrangement of this table is the same as that of Table 4. The measurements which have been correlated are dry weight, length of right fore wing, width of right fore wing, sum of the widths of the third and the fourth tergites, and length of proboscis. Similar to Table 4, those values which are highly significant correlations are starred with one star, those values which are significant but not highly so are starred with two stars, while those values which are unstarred are not significant.
Concerning the data presented in Table 5, the following general assertions can be made: (1) In all three cases the correlations of dry weight with length of right fore wing, dry weight with the sum of the widths of the third and the fourth tergites and dry weight with length of proboscis are significant. (2) The correlations of length of right fore wing with width of right fore wing and length of right fore wing with the sum of the widths of the third and the fourth tergites are significant. (3) The correlation of width of right fore wing with length of proboscis is significant. (4) The following correlations are not significant: dry weight with width of right fore wing, length of right fore wing with length of proboscis, width for right fore wing with the sum of the widths of the third and fourth tergites and the sum of the width of the third and the fourth tergites with length of proboscis.
In Table 6 are presented the correlation coefficients of measurements on bees from colony 18. The arrangement of this table is similar to table 4. The measurements upon which correlations have been calculated are dry weight, length of right fore wing, width of right fore wing, sum of the widths of the third and the fourth tergites and length of proboscis. The system for indicating the significance of correlation coefficients is the same as that used in Tables 4 and 5.
Concerning the data presented in Table 6, the following general assertions can be made: (1) The correlation coefficients of dry weight with length of right fore wing, dry weight with the sum of the widths of the third and the fourth tergites, length of right fore wing with width of right fore wing and width of right fore wing with length of proboscis are significant. (2) The correlation coefficients of dry weight with width of right fore wing, dry weight with length of proboscis, length of right fore wing with the sum of the widths of the third and the fourth tergites, length of right fore wing with length of proboscis, width of right fore wing with the sum of the widths of the third and the fourth tergites and the sum of the widths of the third and the fourth tergites with length of proboscis are not significant.
From the data presented in Tables 1, 2, 3, 4, 5 and 6, it is evident that the samples of bees from colony 25 are more homogeneous than the samples of bees from colony 21 and colony 18. Consequently, a further study of the variability of the worker bee as influenced by size of brood cell will be concerned with the bees from colony 25.
Throughout the following presentation of data, the measurements on the parts of the bee will be designated as follows: (A) dry weight, (B) length of right foe wing, (C) width of right fore wing, (D) sum of the widths of the third and the fourth tergites and (X) the measurement upon which the regression is made.
Throughout the following presentation of data, the measurements on the parts of the bee will be designated as follows: (A) dry weight, (B) length of right foe wing, (C) width of right fore wing, (D) sum of the widths of the third and the fourth tergites and (X) the measurement upon which the regression is made.
In Table 7 are presented further data concerning the measurements of bees from colony 25 in which there is a regression of (A) dry weight, (B) length of right fore wing, (C) width of right fore wing and (D) sum of the widths of the third and the fourth tergites on (X) length of proboscis. The data consist of the standard deviations of the above-mentioned measurements, the standard regression coefficients, the multiple correlation coefficient, the standard error of estimate, the significance of regression and the regression equations for the bees from each size of cell. An analysis of variance of the length of proboscis between and within all three groups, namely, the groups of bees from size of cell “A”, the group of bees from size of cell “B” and the group of bees from size of cell “C”, is also presented.
An examination of the standard deviations of the measurements of the bees from the three sizes of cells shows that the variation is greatest in the case of length of right fore wing and length of proboscis with the bees from size of cell “A” and least in the case of the bees from size of cell “B”. The standard deviation of the width of the right fore wing is greatest in the case of the bees from size of cell “A” and the least in the case of bees from size of cell “C”. The standard deviation of dry weight increases as the size of the cell is increased. The standard deviation of the sum of the widths of the third and the fourth tergites is greatest in the case of the bees from the size of cell “B” and least in the case of bees from the size of cell “A”.
The significance of the standard regression coefficients was tested by dividing the standard regression coefficient by its standard deviation and comparing the resulting value with the significant values for “t” as given in Table 16 by Wallace and Snedecor (69). The significance of the multiple correlation coefficients was determined by comparing the values obtained with significant values of “R” given by Wallace and Snedecor (69) in Table 16. The significance of the regression for the bees from each size of cell and the analysis of variance of length of proboscis of all three groups was tested by calculating one-half the difference of the natural logarithms of the mean squares and comparing the values obtained with the significant values of “Z” as given in Table 6 by Fisher*.
An examination of the standard regression coefficients shows that only the standard regression coefficint of length of proboscis and length of right fore wing is significant for the bees from each of the three sizes of cells. The multiple correlation coefficient for the bees from size of cell “A” and size of cell “C” are highly significant, while the corresponding value for the bees from size of cell “B” is not significant. The “Z” test of the significance of the regressions further substantiates the significance of the multiple correlation coefficients by showing that the regressions of the measurements on the bees from size of cell “A” and size of cell “C” has been significantly accounted for.
A study of the standard errors of estimate shows that the standard deviation of the length of proboscis of bees from size of cell “A” has been reduced 29.61% due to the extension of statistical control over factors relating to length of proboscis. In the case of the bees from size of cell “B” the standard deviation of length of proboscis has only been reduced 2.11%, while in the case of bees from size of cell “C” the reduction is 19.86%. In the latter case, the standard deviation of length of proboscis has been notably reduced by the inclusion of dry weight, length of right fore wing, width of right fore wing and the sum of the widths of the third and the fourth tergites in the regression. A study of the regression equations for the bees from the three sizes of cells shows, in general, that length of the right fore wing is the dominating factor in these estimation equations of length of proboscis.
An analysis of the variance between and within the groups of bees from all three sizes of cells shows that the variation between the groups is significantly greater that that within groups. This further substantiates the proof presented under section 1 of the presentation of data of a significant difference between the means of the length of proboscis of the three groups.
In Table 8 are presented statistical constants of measurements on bees from colony 25 concerning a regression of (A) dry weight, (B) length of right fore wing, (C) width of right fore wing and (D) sum of the widths of the third and the fourth tergites on (X) length of mentum.
In Table 9 are presented data concerning the statistical constants of measurements on bees from colony 25. In this table the regression is dry weight, length of right fore wing, width of right fore wing and sum of the widths of the third and the fourth tergites on length of glossa.
Statistical constants of measurements on bees from colony 25 concerning a regression of dry weight, length of right fore wing, width of right fore wing and sum of the widths of the third and the fourth tergites on the sum of the lengths of the mentum and the glossa are presented in Table 10.
A comparison of Tables 7, 8, 9 and 10 shows that the data presented in Tables 9 and 10 proffer the same conclusions as were drawn from the data of Table 7. From the data presented in Table 8, there is an agreement with the data of the other three tables in the variation of the length of mentum as indicated by the standard deviation of length of mentum of the bees of all three sizes of cells, the multiple correlation coefficient and the significance of the regression of the bees from size of cell “A”, and the analysis of variance of length of mentum between and within the groups from all three sizes of cells. In no cases are the standard regression coefficients significant. In contrast to the data presented in the other three tables, the multiple correlation coefficients and significance of regression for the bees from the size of cell “C” are not significant. An examination of the regression equations shows that length of right fore wing has ceased to be a dominating factor in the estimation of length of proboscis.
*Fisher, R. A., “Statistical Methods for Reasearch Workers”, second edition revised and enlarged. Oliver and Boyd, Edinburgh. 1928.
DISCUSSION
A Biometrical Study of the Influence of Size of Brood Cell Upon the Size and Variability of the Honeybee (Apis mellifera L.) by Roy A. Grout, 1931
The data presented in this paper show conclusively that it is possible to obtain a larger bee through the use of brood combs constructed from artificial foundation having enlarged cell bases. The author, therefore, corroborates the contentions of Baudoux (8) and Pincot, according to Gillet-Croix (26), that the bees reared in enlarged cells are larger than bees reared in normal cells. Even though the data at hand show that an increase in the size of the cells in which the bees are reared is accompanied by an increase in the dry weight, length of right fore wing, width of right fore wing, sum of the length of the third and the fourth tergites and the length of proboscis, the author hesitates to support them in their contentions that the larger bee is a better bee. Since the crucial test is honey production, further experimental data are necessary.
Baudoux’s contentions (8) that the bee reared in the enlarged cell could fly further, would have a greater carrying capacity and could acquire nectar from flowers having a deeper corolla are not substantiated by the data of this experiment. The author is of the opinion that an extensive investigation of these characteristics should be made. Since in this experiment, all three sizes of cells were placed in the same colony in order that the bees emerging from the cells would be the progeny of the same mother, no indication of the increase in the ability of the bee to gather nectar was observed.
The data presented in this paper agree with data presented by Michailov (43 and 44), stating that an increase in the size of the cells in which worker bees are reared is accompanied by a corresponding increase in the weight, length of right fore wing, width of right fore wing, sum of the widths of the third and the fourth tergites and length of proboscis.
Since most writers agree that the principal point in the selection of bees and the acquisition of nectar is length of proboscis, it is of interest to note that in the case of colony 25 the length of proboscis was increased 2.07% through the use of enlarged cells. In the case of colony 21 the length of proboscis was increased 1.51% and in the case of colony 18 the length of proboscis was increased 1.40%. The average maximum increase in the length of the proboscis for the bees of all three colonies is 0.11 mm. Whether this increase in the length of proboscis is significantly related to an increase in the honey production of a colony has yet to be proved.
The general tendencies of the statistical constants of measurements on bees from colonies 25, 18 and 21 reveal the following facts: (1) The measurement of dry weight varies greatly in certain cases and, in general, correlates poorly. Consequently, the author feels that better experimental control should be exercised in the measurement of this character than was used in the present work. (2) The measurement, length of right fore wing, is significantly correlated with all of the other characters. Of the four characters employed in a regression on the length of proboscis and its integral parts the length of the right fore wing is the only character which gives a significant standard regression coefficient and is dominant in those factors used in the estimation of length of proboscis in the regression equations. (3) The width of the right fore wing, while correlating significantly with the length of the right fore wing, shows no tendency to correlate significantly with the sum of the widths of the third and the fourth tergites and dry weight and its tendency to correlate significantly with length of proboscis is questionable. (4) The measurement of the sum of the widths of the third and the fourth tergites tends to correlate significantly with dry weight and length of right fore wing, but there is apparently no significant correlation with width of right fore wing and with length of proboscis. Consequently, the author feels that the sum of the lengths of the third and the fourth tergites is unrelated to length of proboscis and should be omitted in a study of those factors which are related or contribute to length of proboscis. (5) The variation of the character dry weight is greatest in the case of bees from size of cell “C” and least in the case of bees from size of cell “A”. The variation of the width of the right fore wing is greatest in the case of bees from size of cell “A” and least in the case of bees from size of cell “C”. The variation of the sum of the widths of the third and the fourth tergites is greatest in the case of bees from the size of cell “B” and least in the case of bees from size of cell “A”. The variation of the measurements of length of right fore wing and length of proboscis is greatest in the case of bees from size of ell “A” and least in the case of bees from size of cell “B”. Since length of proboscis and length of right fore wing have been shown to be significantly correlated, it is of interest to note that the variation in the three sizes of cells has the same trend.
Since Merrill (42) measured only the glossa in his study on the honey-storing ability of the bee and since the Russian method uses the entire length of the proboscis as measured in this paper, a study was made of length of glossa, length of mentum and sum of the lengths of the glossa and the mentum in relation to length of proboscis. While all three measurements correlate significantly with length of proboscis, it was found that length of mentum was not as good an estimation of length of proboscis as was length of glossa and the sum of the lengths of the glossa and mentum. This study substantiates the methods of both the above mentioned sources.
The inconsistencies arising in the data presented in this paper can be attributed only to a lack of proper technique in the treatment of the material and to the fact, that, while the bees were selected from a specific size of cell and were the progeny of the same mother, they were, nevertheless, selected at random from a large population. Consequently, even though it connot be determined to what extent the above factors operated, the author feels that many of the inconsistencies of the data can be attributed to these causes.
Due to these inconsistencies arising in nearly all of the statistical constants presented in this paper, the author is of the opinion that the use of samples containing a larger number of bees selected from each size of cell would strongly tend to give consistently significant results. This opinion is substantiated by Phillips (53), who discounted the work of Merrill (42) on the basis that the correlations presented in his data were based on small numbers of bees taken at intervals during the season. Merrill (49) calculated that it was necessary to examine only forty bees of a colony in order to determine which colony would produce the most honey. The data at hand show that this is not always the case.
Contributing to the peculiarities of the correlations, particularly in the case of the correlation coefficients of length of proboscis with the lengths of its integral parts, is the fact that in certain cases there are spurious correlations. For example, even though length of glossa is significantly correlated with length of proboscis and length of mentum is significantly correlated with length of proboscis, length of mentum is not significantly correlated with length of glossa.
In this experiment, as has been previously stated, all three sizes of cells were placed in the same colony in order that the emerging bees would be the progeny of the same mother. While the worker bees extended the side walls of the cells of the combs in a normal manner and immediately proceeded to make use of the cells, at least for storage purposes, difficulties were experienced in getting the queens to oviposit worker eggs in the enlarged cells. This was especially true in the case of size of cell “C”. The combs containing size of cell “C” were often found to contain patches of drone brood and little or no worker brood. These observations showed that, while the worker bees apparently recognized no difference in the three sizes of cells, the queen bees showed a tendency to prefer the smaller cells for ovipositing. This observation agrees with experiments conducted by Lovchinovskaya (39), who showed that, when nine combs containing normal cells and one comb containing enlarged cells were placed in a colony, the worker bees apparently recognized no difference in the size of the cells but that the queen bee apparently recognized this difference and did not oviposit in the enlarged cells. In the reverse experiment the queen bee oviposited in the enlarged cells.
From a single brood count made by the author during the summer of 1931 on colonies entirely supplied with combs containing size of cells “A”, colonies entirely supplied with combs containing size of cells “B” and colonies entirely supplied with combs containing size of cells “C”, it was shown that the reaction of the colonies to each size of cell was apparently the same. While this observation corroborates the latter experiment of Lovchinovskaya (39) and the experiences of Baudoux (8), the author feels that further experiments, concerning the brood activities of colonies supplied with combs containing enlarged cells, should be made throughout a period of two or more seasons.
While this paper was being prepared, a correlation of dry weight, length of right fore wing, width of right fore wing, sum of the widths of the third and the fourth tergites, length of proboscis and length of the second member of the right labial palpus was calculated on bees from the three sizes of cells from colony 14. Of special interest in this correlation is the fact that only in the case of the bees from size of cell “A” was the correlation coefficient of length of proboscis with the length of the second member of the right labial palpus significant. The correlation coefficients of these factors in the other two groups were insignificant.
Gotze (29), in a recent paper, did not follow the Russian technique for measuring the individual parts of the proboscis and proclaimed that the probability of error in this technique of measurement was so great that it was quite easy, with small differences of individual colonies, to obtain incorrect results. He states that with all the colonies that he “accurately investigated” it was found that the length of the second member of the labial palpus varies with the total length of the proboscis. In his studies he obtained a judgment of the second member of the labial palpus and prescribed a definite formula by which the length of proboscis was estimated from the value of the measurement of the second member of the labial palpus.
A further comparison of the standard deviations of length of proboscis and length of the second member of the right labial palpus shows that the variability in the three sizes of cell differs between the two measurements. The variability of the length of proboscis is greatest in the case of bees from size of cell “C” and least in the case of bees from size of cell “B”, while the variability of the length of the second member of the right labial palpus is greatest in the case of bees from size of cell “B” and least in the case of bees from size of cell “C”. From this data it is shown that the variability of these two parts as influenced by size of cell is not at all consistent. From the combined study of the correlation coefficients and the standard deviations, it is shown that the second member of the right labial palpus is not related to length of proboscis and does not vary with it. Consequently, the author cannot agree with the conclusions of Gotze (29) upon this subject.
The author takes this opportunity to strongly recommend the technique of measuring the individual parts of the bee as described under “Methods and Materials” in this paper. With a little practice, from three to four measurements could be taken per minute, a speed which would be very difficult to obtain through the use of an ocular micrometer in a binocular microscope. A comparison of the measurements taken by means of the projection system with those taken by means of an ocular micrometer in a binocular scope showed that the projection system is just as accurate, if not more so.
SUMMARY
A Biometrical Study of the Influence of Size of Brood Cell Upon the Size and Variability of the Honeybee (Apis mellifera L.) by Roy A. Grout, 1931
1. The size of the worker bee as represented by the size of the various parts is significantly increased through the use of brood combs containing enlarged cells.
2. The average percent of increase of the linear measurements of the worker bee is directly proportional to the percent of increase of the diameter of the brood cell.
3. The number of bees used in a sample in this experiment is not large enough to give wholly consistent results, but these results are in general significant and indicative.
4. The measurement of the dry weight is not sufficiently controlled by the present experimental technique.
5. The correlations of length of right fore wing with the other measurements of the worker bee are highly significant.
6. Among the measurements taken in this work the length of the right fore wing gives the best statistical estimation of length of proboscis.
7. The correlations of width of right fore wing with the other measurements are significant but not highly so.
8. The correlations of the sum of the widths of the third and the fourth tergites with the other measurements are in general not significant.
9. The greatest variation of length of proboscis, length of right fore wing and width of right fore wing occurs in the bees from combs having 857 cells per square decimeter.
10. The least variation of length of proboscis and length of right fore wing occurs in the bees from combs having 763 cells per square decimeter, while the least variation of width of right fore wing occurs in the bees from combs having 706 cells per square decimeter.
11. The length of glossa and sum of the lengths of the glossa and the mentum are as highly correlated with the other measurements as is length of proboscis.
12. The length of the mentum is not as highly correlated with the other measurements as are the length of the glossa, the length of the proboscis and the sum of the lengths of the mentum and the glossa.
13. The second member of the right labial palpus is not significantly correlated with length of proboscis.
14. The least variation of the length of the second member of the right labial palpus occurs among those bees in which the variation of the length of proboscis is greatest and vice versa.